

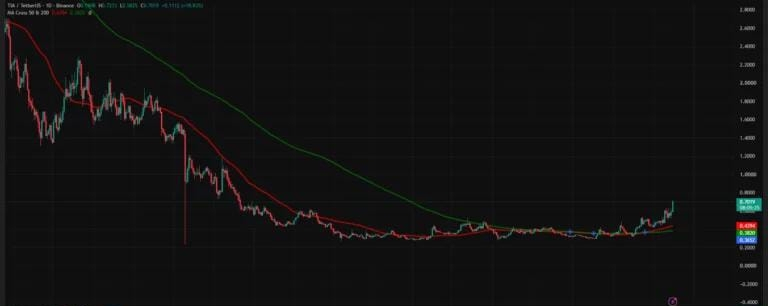

Celestia price has climbed above $0.70 as strengthening daily momentum and a bullish weekly trend put its recovery from a months-long trading range to the test.
Celestia’s ( $TIA ) recovery has accelerated after spending much of the year trading near the bottom of a prolonged decline. Daily TIA/USDT chart showed the token at $0.7019 at 3:54 p.m. UTC on Oct. 16, following a session high of $0.7233.
Celestia’s breakout has support across both timeframes
TIA’s 50-day moving average stood at $0.4394, above its 200-day average at $0.3820. Price was trading roughly 60% above the shorter average, showing how quickly the rally has pulled away from its recent trend.
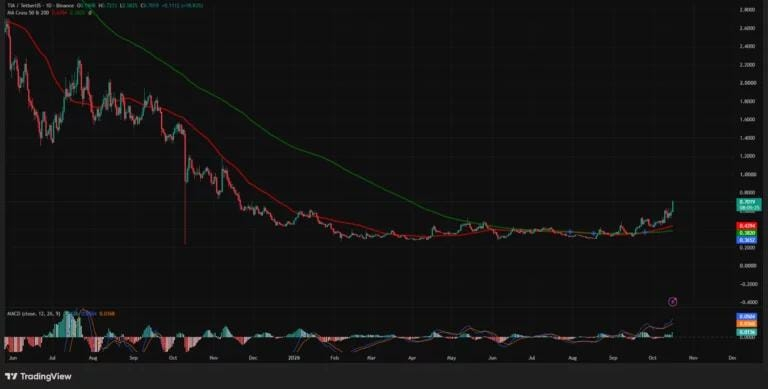
That distance leaves room for a sizeable pullback even if the broader recovery survives. A retreat toward the recent $0.58–$0.60 trading area would erase part of the latest advance while keeping TIA above both moving averages.
Daily momentum still favors buyers. The MACD line reached 0.0504 against a signal line of 0.0368, with a positive histogram of 0.0136. Both lines were above zero, supporting a stronger upward trend rather than merely slowing losses.
The weekly chart adds weight to that reading. TIA was up approximately 21% from the week’s opening price, while RSI reached 64.98, above its smoothing line at 46.80. Momentum has moved firmly above the neutral midpoint without reaching the conventional overbought threshold of 70.
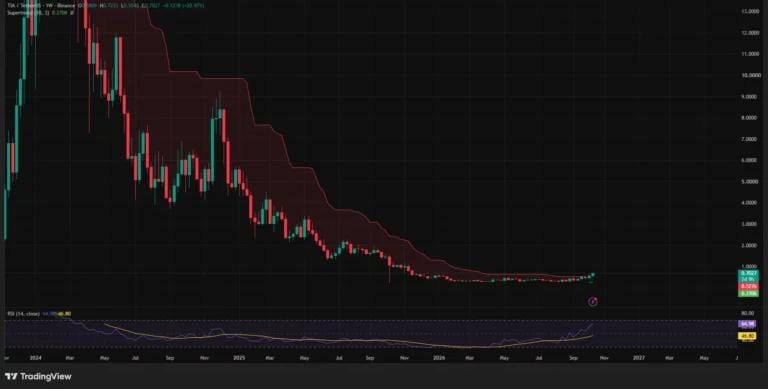
Weekly Supertrend also showed a bullish reading, with its active green line at $0.2706. That level sits well below the market, making the recent weekly low near $0.505 a closer reference for assessing whether the breakout is losing ground.
Celestia has produced sharp rebounds before. A July 2025 rally took TIA up 14% alongside a descending-channel breakout, but the longer price history shows that recovery eventually gave way to further declines. The current advance has stronger alignment between daily momentum and weekly trend signals, though holding above the former range remains essential.