


In classic Technical Analysis, BTC has been moving sideways for 9 days on the daily timeframe, while the weekly alerts danger: Tweezer Top, Hanging Man, and a sharp drop in volume ($13.4B vs. $33B average). While retail screams "top," smart money sees structural health in the on-chain data.
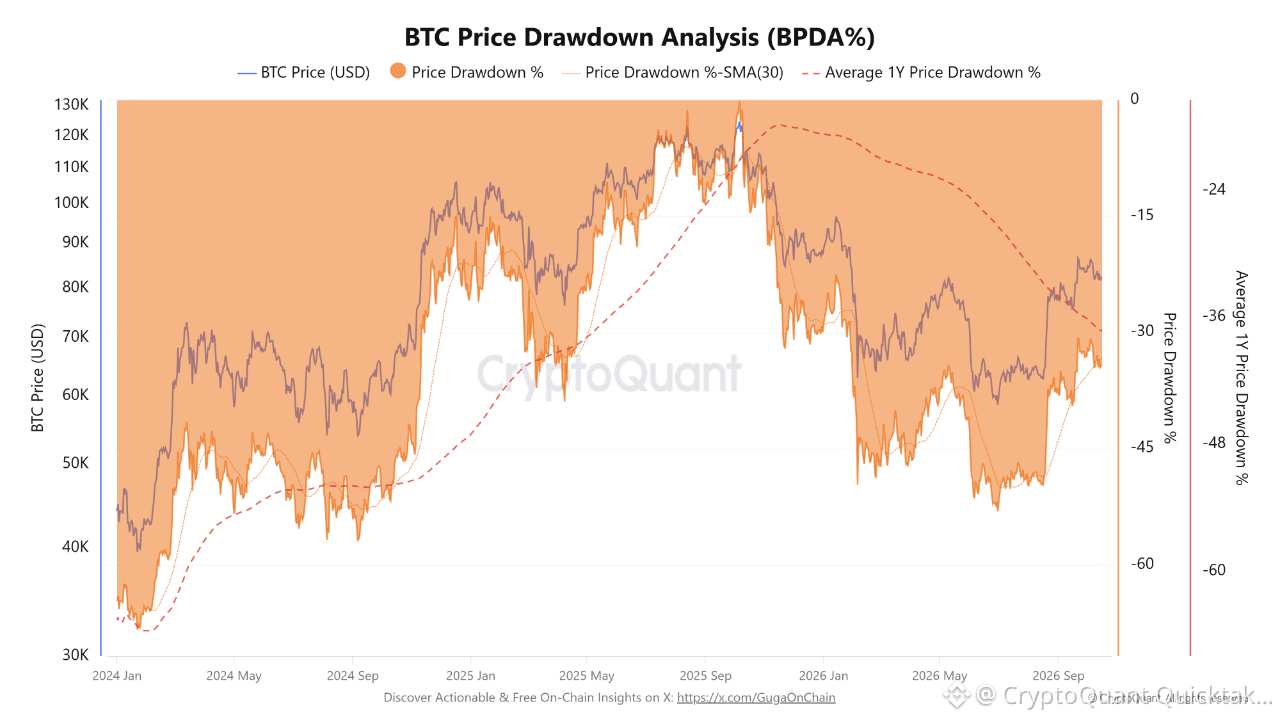
**BTC PRICE DRAWDOWN ANALYSIS (BPDA%)**
This indicator dismantles the bias and converts the nominal price into a macro stress metric. Currently quoted at $82,138 (+1.13%/24h | -0.44%/7d), the diagnosis is surgical:
◾ **Bear Escape:** The 1-year average drawdown is -37.29%. Trading above it (-34.21%) confirms the break of the macro bearish structure.
◾ **Mathematical Friction:** The price stalled because the -34.21% drawdown collided with the SMA30 (-33.24%). It is a technical bottleneck, not distribution.
**ON-CHAIN: COOLING DOWN, NOT EXHAUSTION**
◾ **Neutrality:** The Bitcoin: Market Balance Index (MBI) indicator rests at 0.5095 (Neutral Zone) and the MVRV STH marks 1.09, far from macro exhaustion (>1.50).
◾ **Momentum:** The Bitcoin Price Momentum touched the 20.00 line (Weakness), justifying the volume drought. The fuel has temporarily run out.
**STRUCTURAL VERDICT**
On the daily, the price refuses to melt, forming hammers on the MA50 ($81,259). Selling out of fear of the weekly Hanging Man is ignoring the flow. Compared to the ATH ($124,709) set on 10/06/25, we are navigating with a 34% structural discount, cooling the engines at the daily average ($83,606) to prepare for the expansion towards the weekly upper Band at $89,600. Focus on the macro!
Written by GugaOnChain