


Bitcoin is attempting to break through an “inflection frontier” that has historically triggered runs to new macro highs.
Key points:
Bitcoin (BTC) may continue to new all-time highs if it successfully breaks through its 20-month moving average at $87,165, CryptoQuant reported.
The market cycle signals metric showed BTC/USD poised to reclaim this “inflection frontier,” which it lost in December 2025.
CryptoQuant’s bull-bear market cycle indicator continued to show Bitcoin as being in a bull market.
Analysis: Bitcoin “reset” complete as key trend line reappears
Data from onchain analytics platform CryptoQuant reveals that BTC/USD has begun a fresh battle with its 20-month simple moving average (SMA).
The 20-month SMA, at $87,165 as of Oct. 16, is the trend line around which the popular Bollinger Bands metric is constructed. This in turn forms the basis for CryptoQuant’s market cycle signals tool, which seeks to pinpoint Bitcoin’s position within its market cycle.
Bollinger Bands uses standard deviation to add an upper and lower band around the 20-month SMA. Currently, these sit at $121,640 and $52,694, respectively. CryptoQuant’s indicator describes the zone between the lower band and SMA as an “accumulation base,” while the SMA itself is referred to as an “inflection frontier,” a previous point of investor capitulation as price broke below it from above, most recently in December 2025.
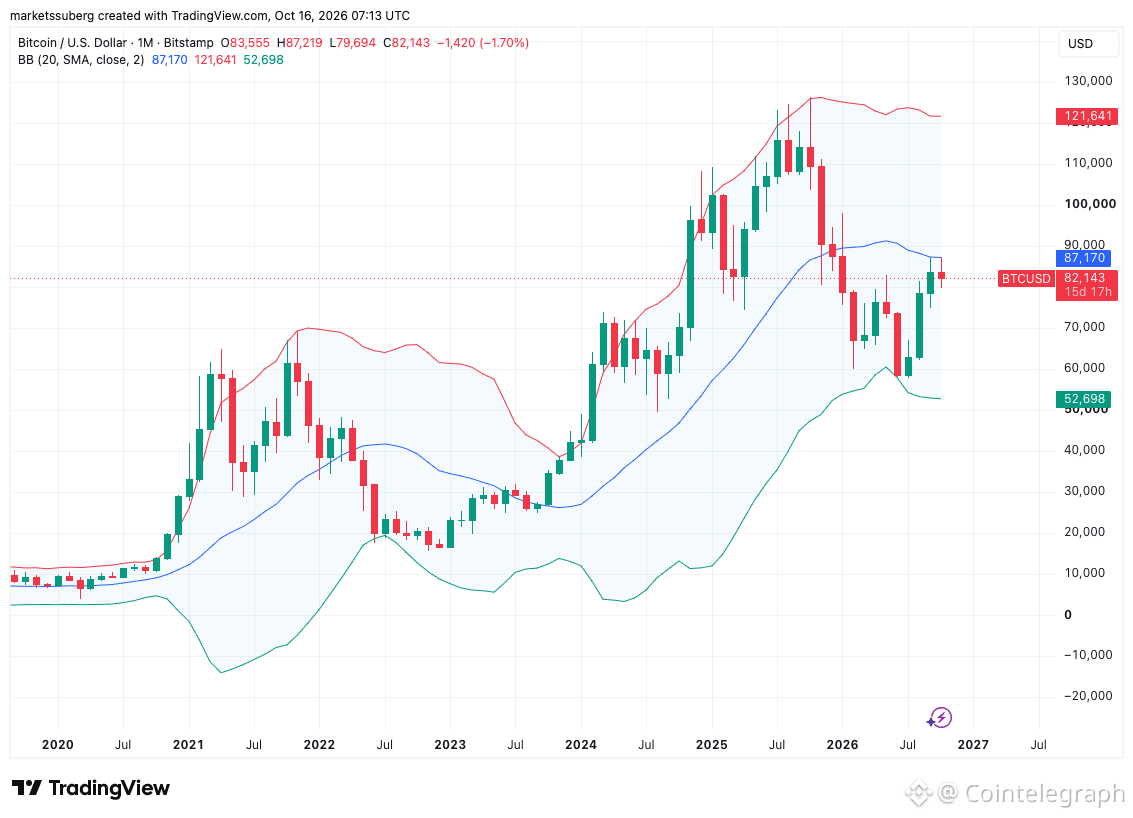
BTC/USD one-month chart with Bollinger Bands. Source: Cointelegraph/TradingView
With Bitcoin now preparing to challenge the capitulation zone from below, history shows that successful breakouts have led to new cycle highs.
“Just over a year after the all-time high (ATH) of $124,709 on October 6, 2025, the market has concluded its ‘reset,’” CryptoQuant contributor GugaOnChain summarized in a blog post.
While Bollinger Bands are not intended to offer buy and sell signals, market cycle signals sees “smart money” taking profit once BTC/USD reaches its upper band. While this currently sits just below Bitcoin’s most recent all-time high of $126,200 from October 2025, CryptoQuant sees the next rally continuing beyond that level.
“While retail fears the current $82,442, thinking it’s the ‘top,’ the on-chain indicator BTC: Market Cycle Signals reveals that we are just warming up,” GugaOnChain added, referring to a current BTC price support zone.
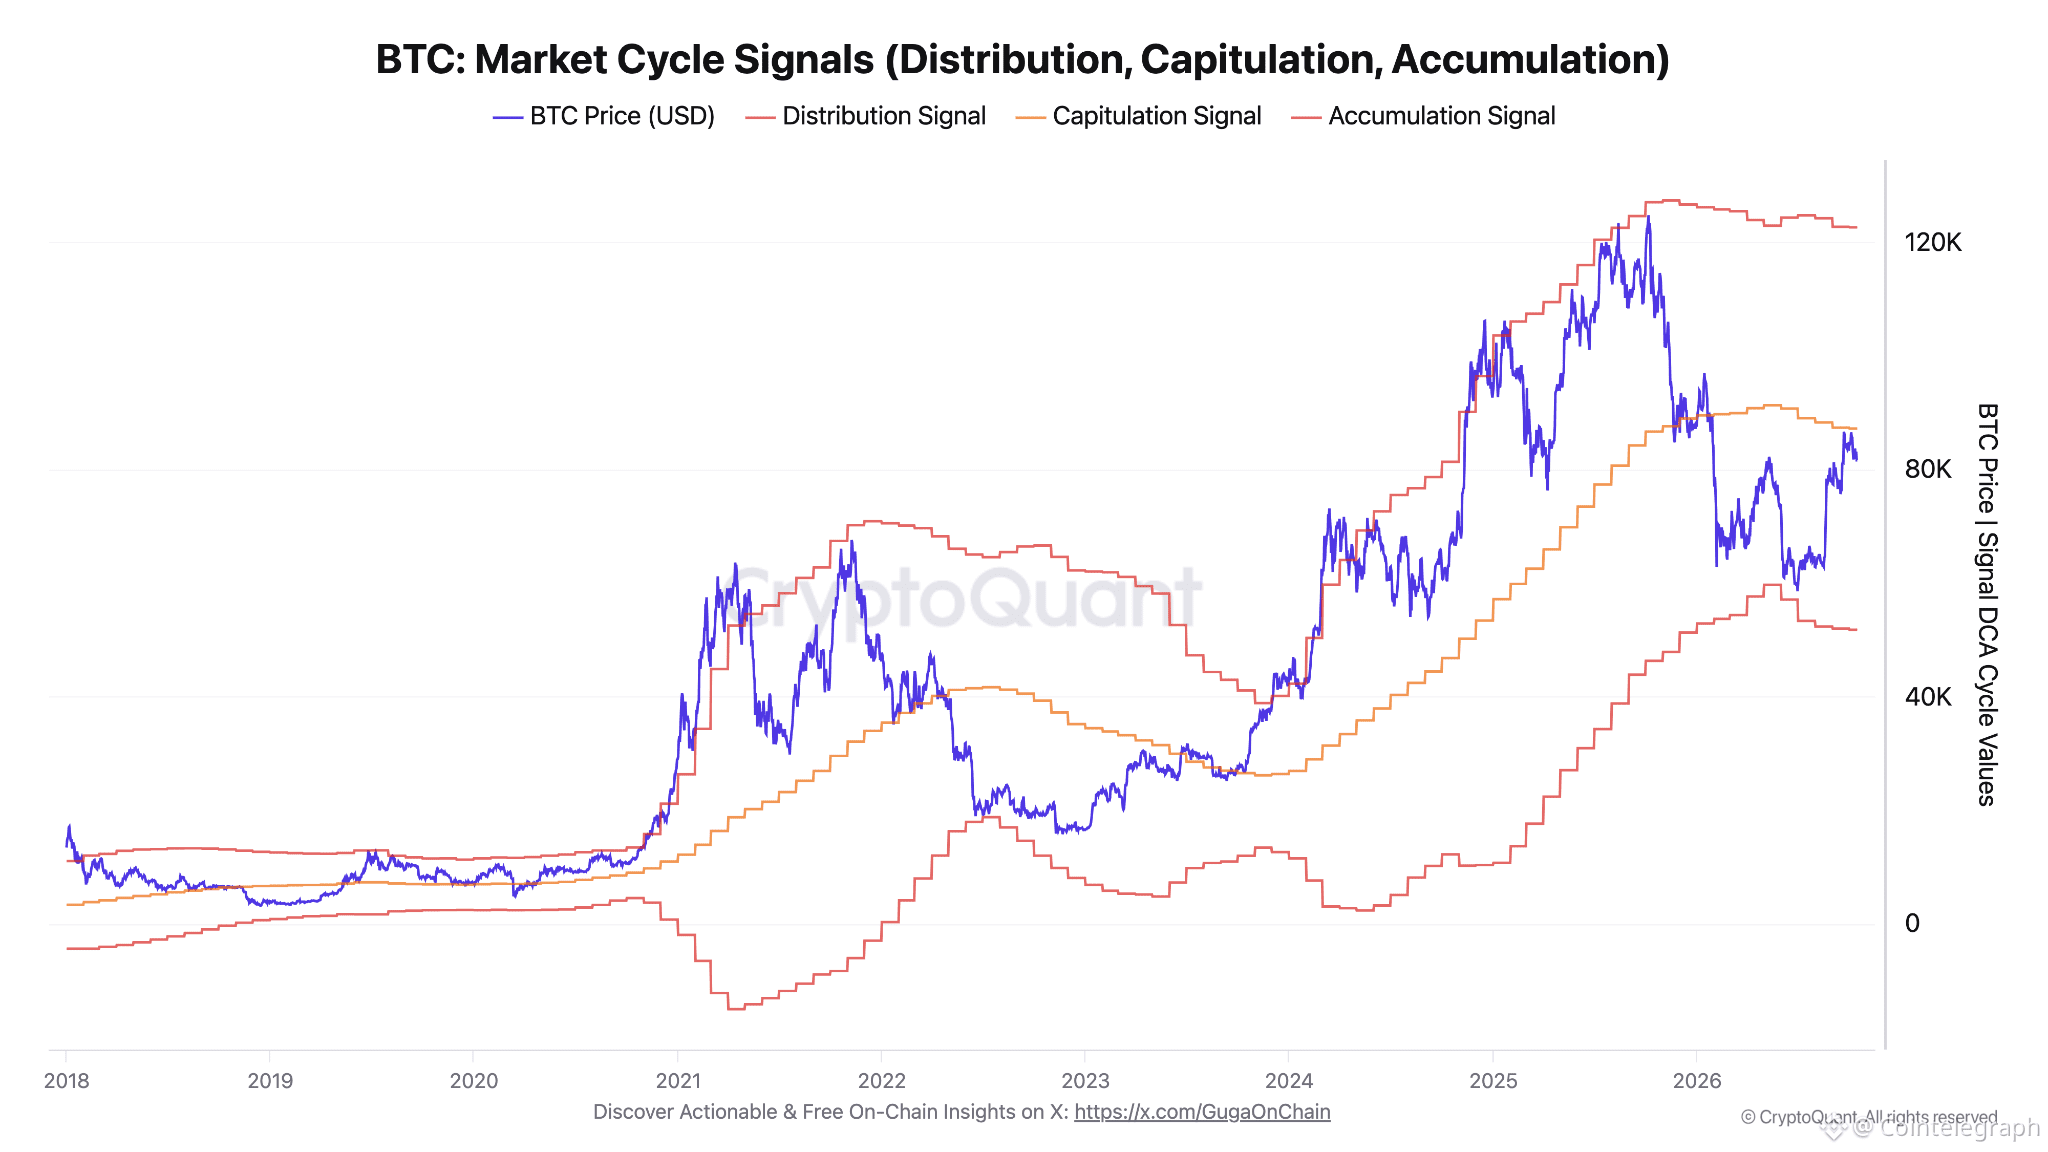
Bitcoin market cycle signals chart. Source: CryptoQuant
The 20-month SMA has confluence with Bitcoin’s 2026 opening level at $87,490, boosting its strength as resistance. As Cointelegraph reported, large walls of ask liquidity remain in the vicinity across exchange order books.
Onchain data shows entrenching Bitcoin bull market
CryptoQuant maintains a broadly optimistic stance on Bitcoin’s emerging bull market despite crypto and risk assets navigating macroeconomic headwinds.
This week, contributor XWIN Research Japan flagged data from three onchain metrics that they said gave reason for “cautious optimism” for bullish momentum to return through the end of October.
In late August, CEO Ki Young Ju officially stated that the bear market was “over” based on readings from the bull-bear market cycle indicator. This uses composite data from several onchain profitability metrics, and shows bullish momentum accelerating with a reading of 0.186 on its scale versus 0.042 in August.
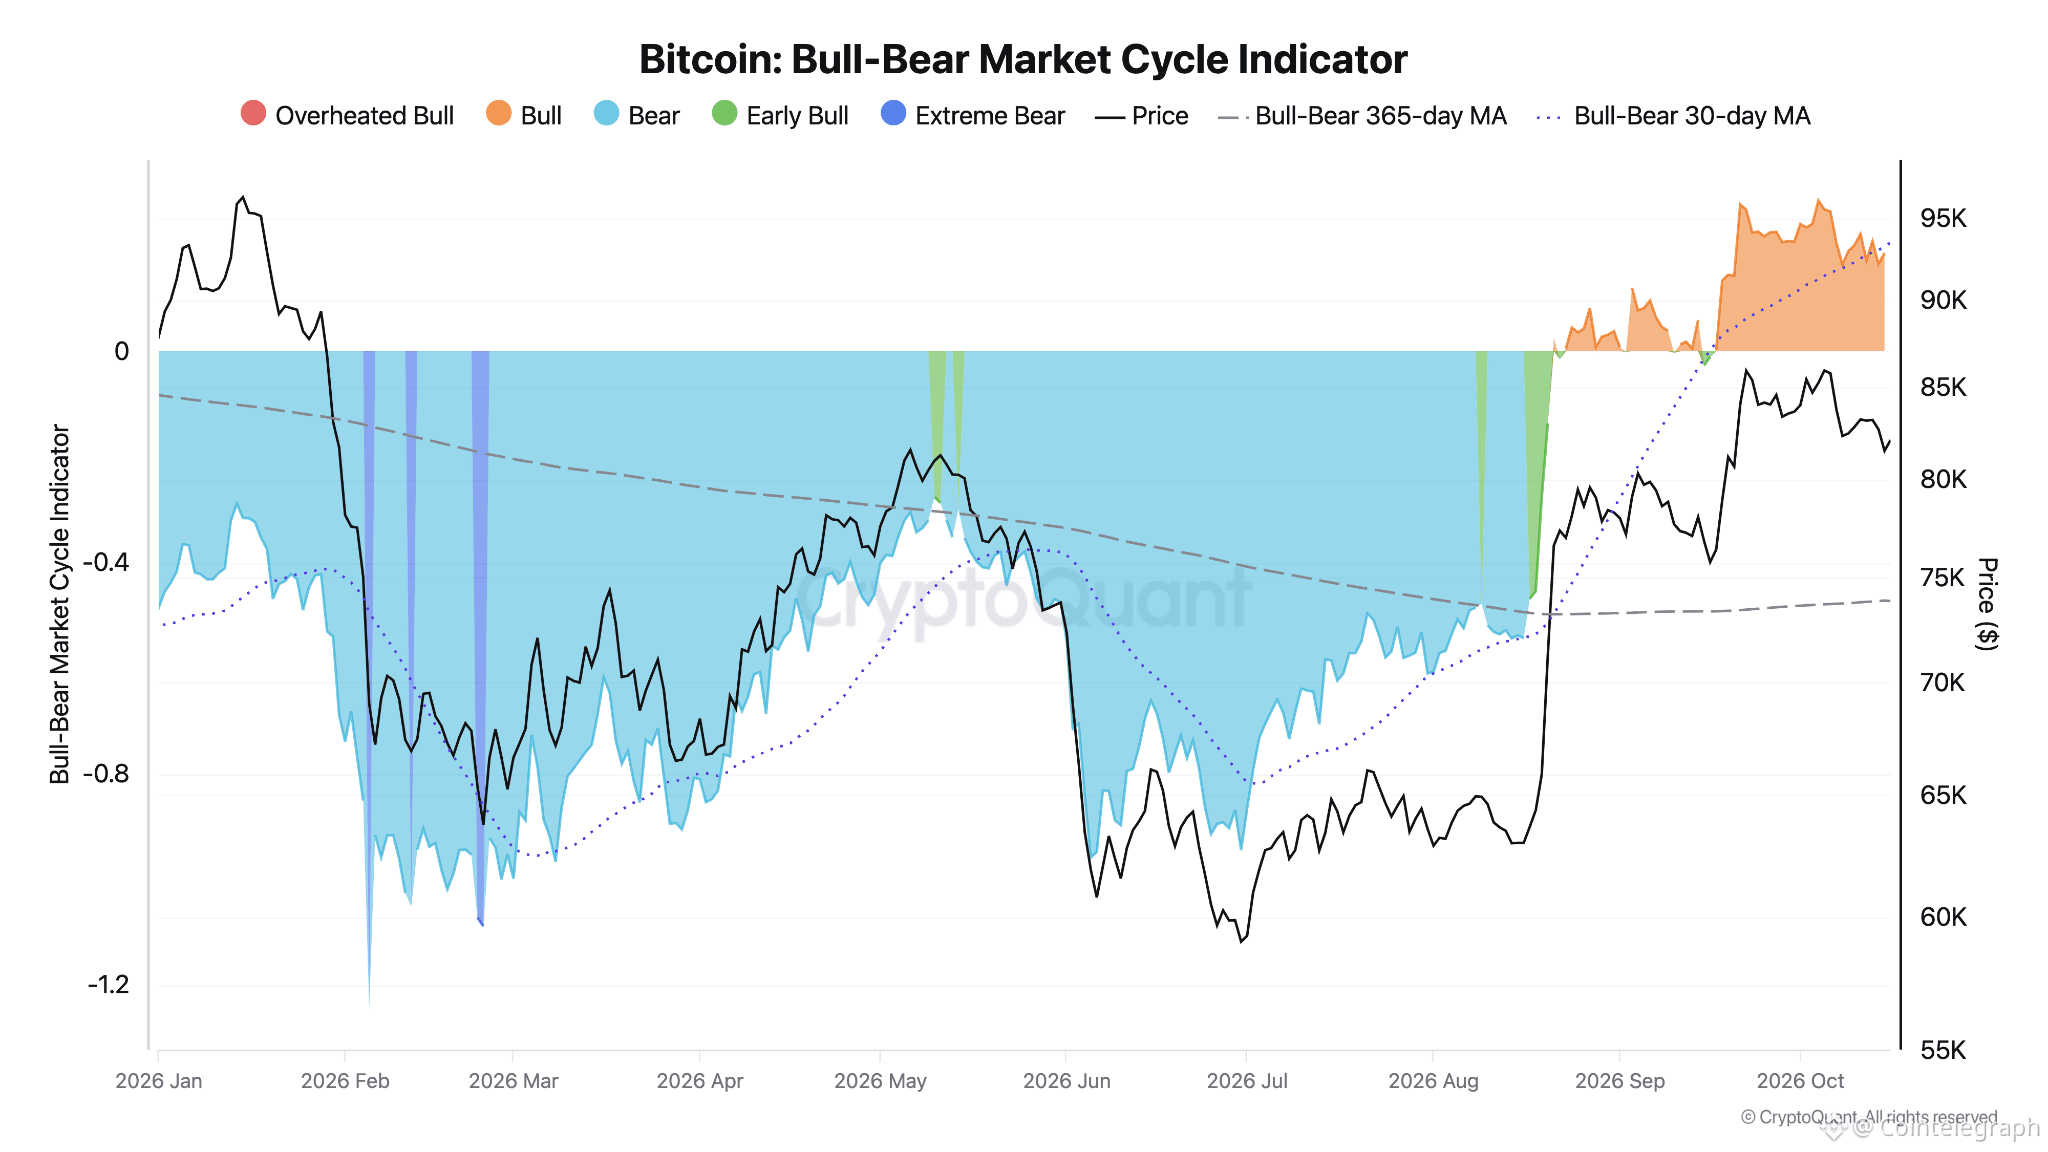
Bitcoin bull-bear market cycle Indicator. Source: CryptoQuant