

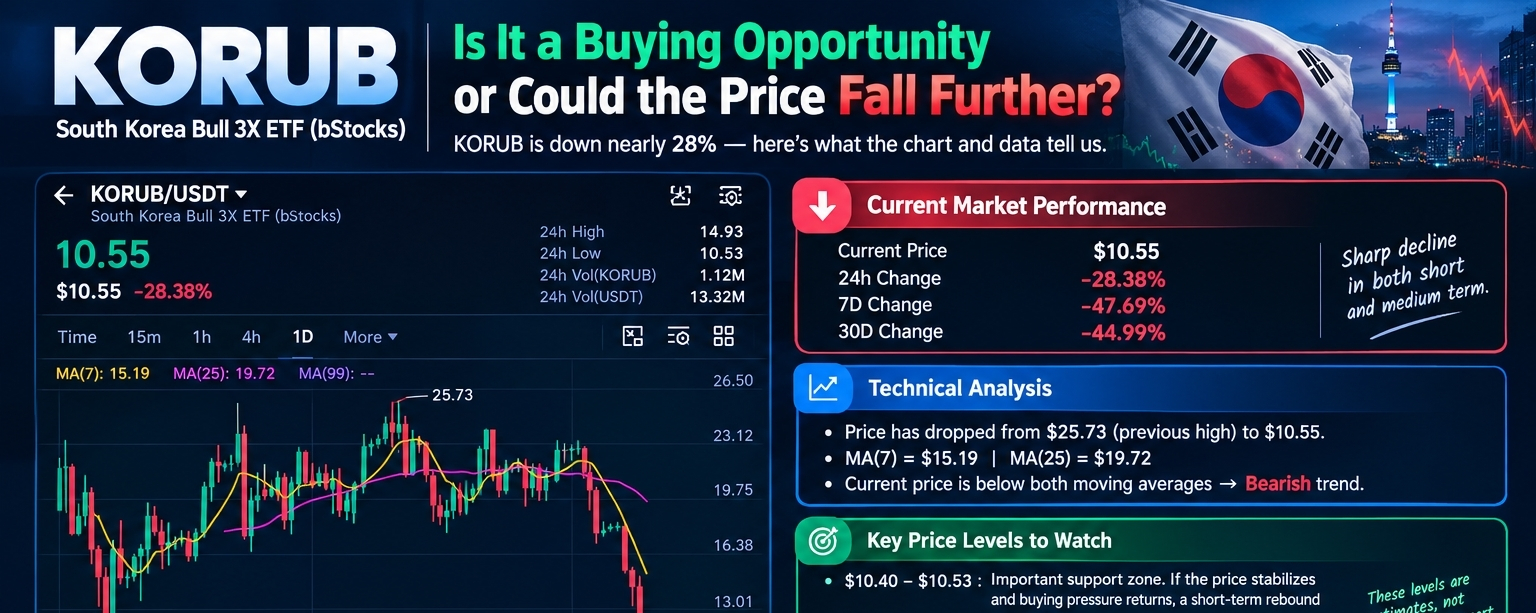

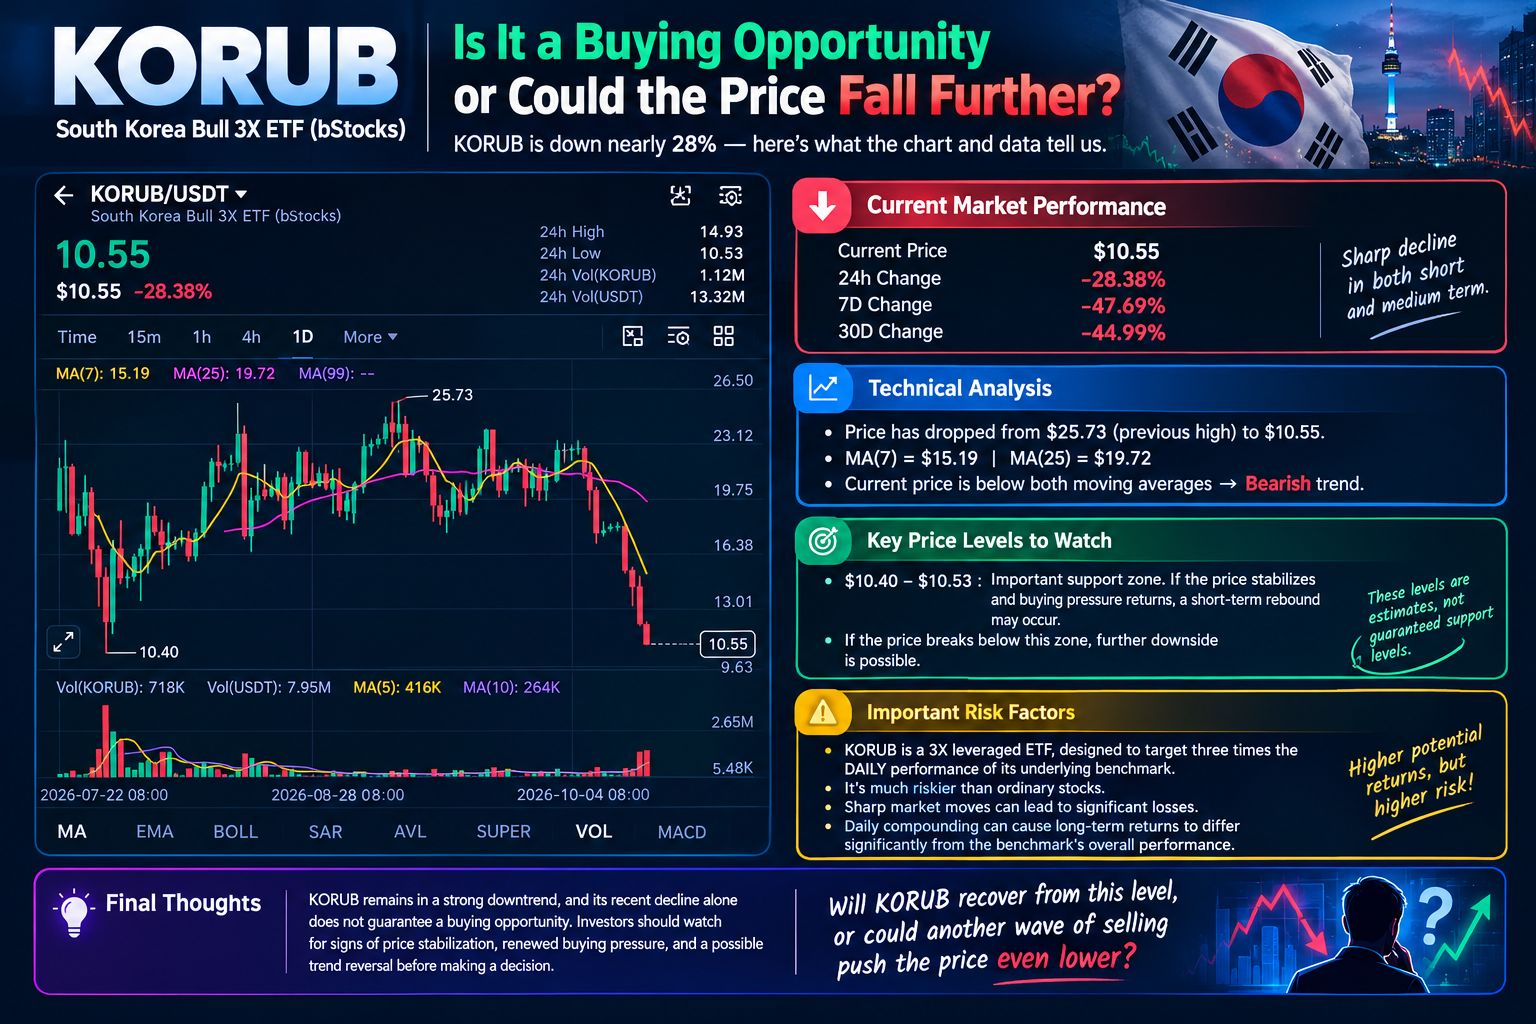
(South Korea Bull 3X ETF – bStocks) is facing significant selling pressure. According to the Binance chart provided, its current price is $10.55, down 28.38% in 24 hours. It has also fallen 47.69% over seven days and 44.99% over 30 days. These figures indicate a strong downward trend.
📊 Technical Analysis
The daily chart shows that KORUB has dropped sharply from its previous high of $25.73 to $10.55. Its 7-day moving average (MA7) is $15.19, while its 25-day moving average (MA25) is $19.72. Since the current price is trading below both moving averages, the technical outlook remains bearish.
🔎 Key Price Levels to Watch
The $10.40–$10.53 zone is an important area to monitor based on the chart. If the price stabilizes here and buying pressure returns, a short-term rebound may occur. However, if the price breaks below this zone, further downside remains possible. These levels are estimates, not guaranteed support levels.
⚠️ Important Risk Factors
KORUB is a 3X leveraged ETF designed to target three times the DAILY performance of its underlying benchmark. This makes it significantly riskier than ordinary stocks. Sharp market movements can lead to substantial losses, and daily compounding can cause long-term returns to differ considerably from the benchmark's overall performance.
📈 Final Thoughts
KORUB remains in a strong downward trend, and its recent decline alone does not guarantee a buying opportunity. Investors should watch for signs of price stabilization, renewed buying pressure, and a possible trend reversal before making a decision.
What do you think? Can KORUB recover from this level, or could another wave of selling push the price even lower
Do Your Own Research.