

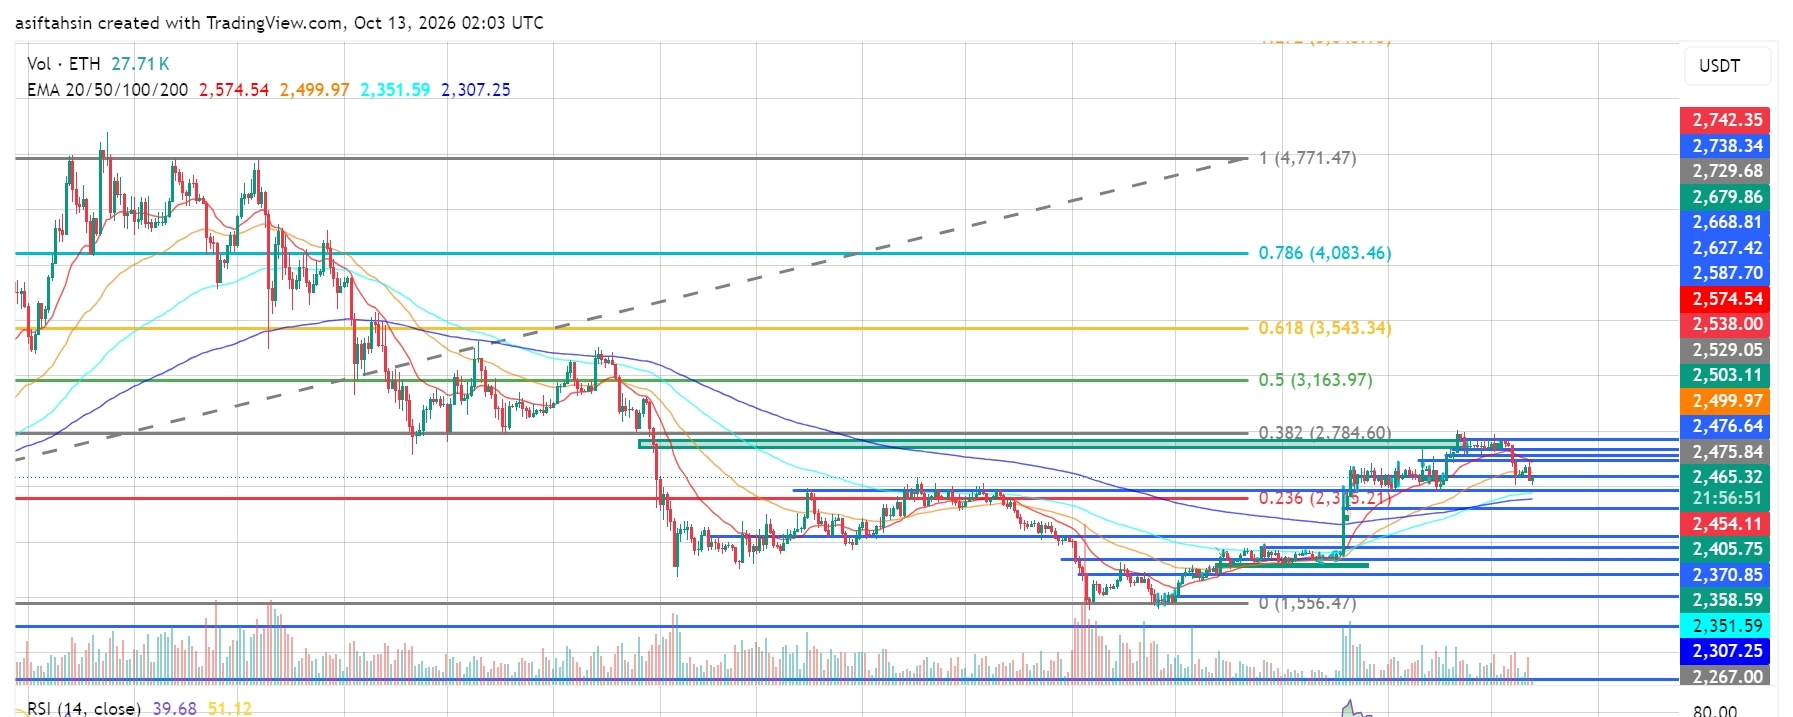

ETH is currently trading around $2,465, pulling back after facing rejection near the $2,476–$2,500 resistance zone.
The broader recovery from the June low near $1,556 remains visible, but short-term momentum has weakened considerably. ETH is now testing support around the $2,454–$2,405 region, making this an important zone for determining whether buyers can stabilize price or sellers push the correction further.
📈 EMA Structure
20 EMA: $2,574.54 50 EMA: $2,499.97 100 EMA: $2,351.59 200 EMA: $2,307.25
ETH has fallen below both the 20 EMA and 50 EMA, signaling short-term bearish pressure.
The $2,500–$2,575 area is now an important recovery zone. ETH needs to reclaim these moving averages to strengthen the bullish structure.
The 100 EMA at $2,351.59 and 200 EMA at $2,307.25 remain important deeper supports if the current pullback continues.
📐 Fibonacci Levels
* 0: $1,556.47
* 0.236: $2,315.21
* 0.382: $2,784.60
* 0.5: $3,163.97
* 0.618: $3,543.34
* 0.786: $4,083.46
* 1.0: $4,771.47
ETH has rejected the region below the 0.382 Fibonacci level at $2,784.60 and is now trading below the short-term moving averages.
A recovery above $2,500–$2,575 would be an early sign of improving momentum. A stronger breakout above $2,784.60 would bring the higher Fibonacci targets back into focus.
🟢 Bullish Scenario
ETH needs to hold the nearby support zone and reclaim resistance.
Key resistance levels:
$2,476.64 → $2,499.97 → $2,538 → $2,574.54 → $2,627.42 → $2,668.81 → $2,784.60
If buyers reclaim the 20 EMA and sustain a move above $2,575, ETH could attempt another move toward $2,627–$2,669.
A confirmed breakout above $2,784.60 could open the path toward:
$3,163.97 → $3,543.34 → $4,083.46
🔴 Pullback Scenario
Important support levels:
$2,454.11 → $2,405.75 → $2,370.85 → $2,358.59 → $2,351.59 → $2,307.25 → $2,267
The $2,454–$2,405 zone is the immediate area to watch.
If ETH loses $2,405 decisively, the next potential support zone sits around $2,370–$2,351, near the 100 EMA.
A sustained breakdown below $2,351 could expose the 200 EMA at $2,307 and the lower support near $2,267.
🧠 Market Structure & Liquidity
The broader structure can be described as:
Liquidity Sweep → Accumulation → Higher Lows → Breakout → Resistance Rejection → Pullback → Support Test
ETH recovered strongly from the June low near $1,556 and climbed toward the $2,784 Fibonacci resistance.
However, the latest rejection has pushed price below the 20 and 50 EMAs. Buyers now need to defend the nearby support region and reclaim lost levels to prevent the pullback from becoming a deeper correction.
📊 RSI Momentum
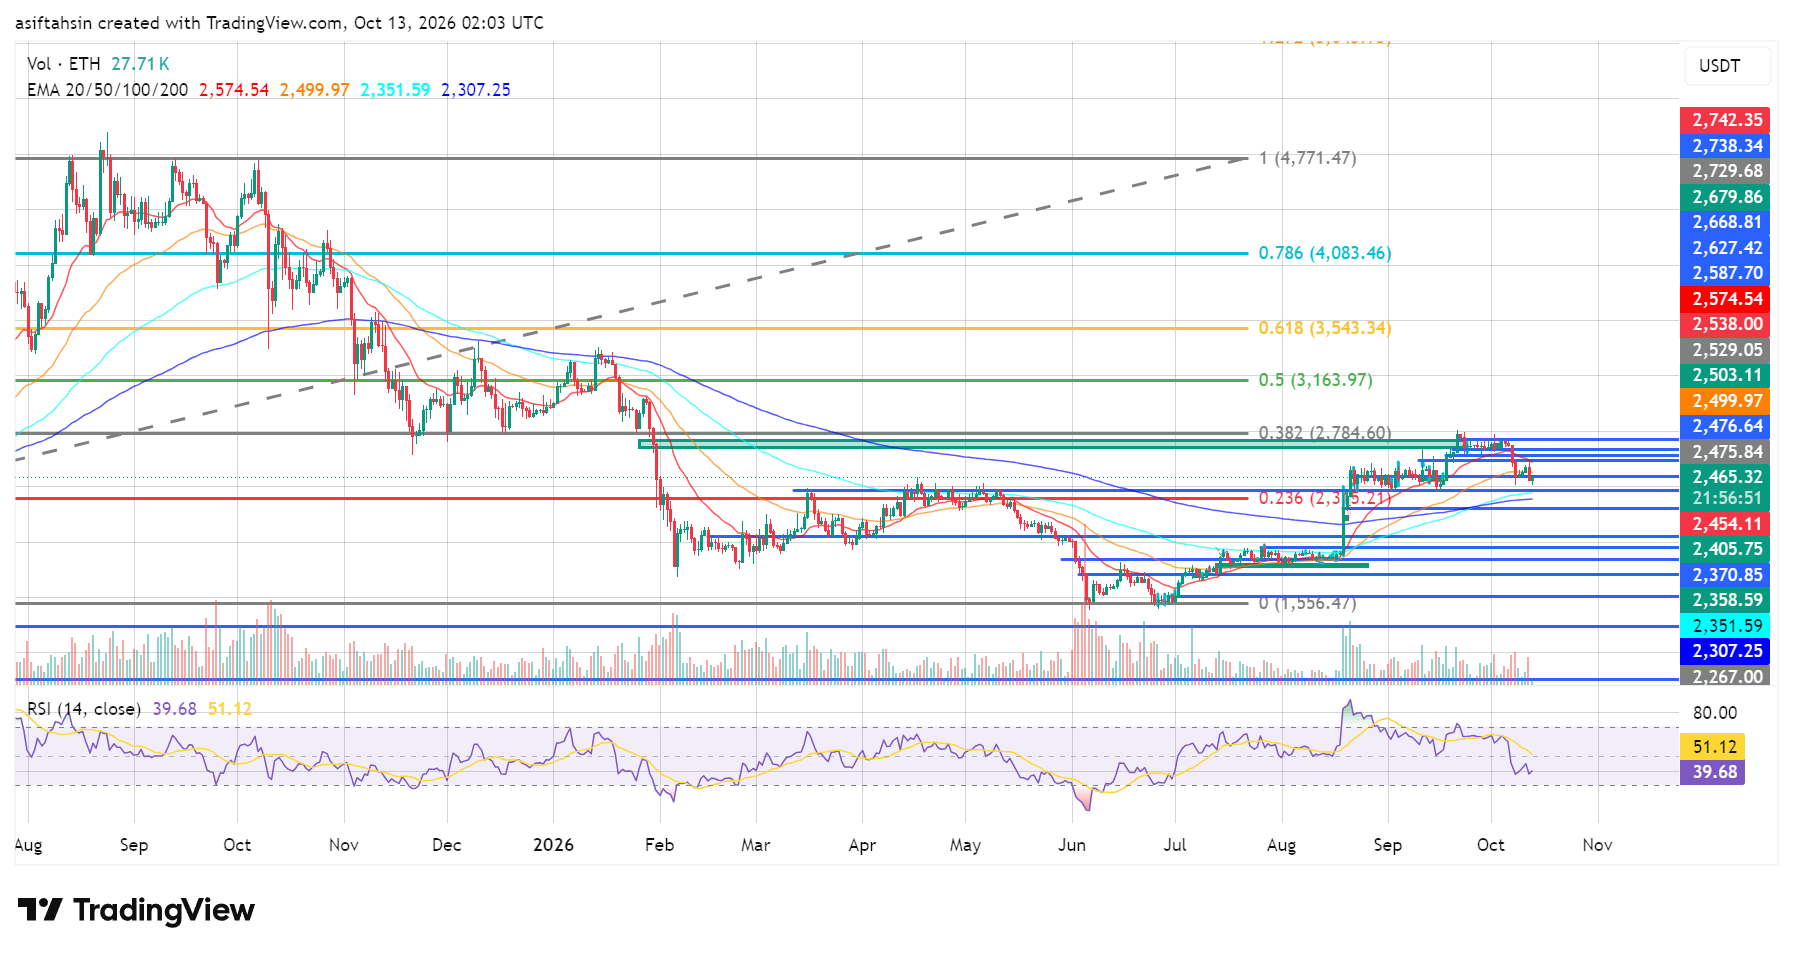
RSI: 39.68 RSI MA: 51.12
RSI has dropped below the neutral 50 level and is trading well below its moving average.
This indicates weakening momentum and increased selling pressure. RSI is approaching the oversold region, but that alone does not confirm a reversal.
A recovery above 50 would provide an early signal that bullish momentum is returning.
🎯 Key Levels
Resistance: $2,476.64 → $2,499.97 → $2,538 → $2,574.54 → $2,668.81 → $2,784.60
Support: $2,454.11 → $2,405.75 → $2,370.85 → $2,351.59 → $2,307.25 → $2,267
Major EMA Support: $2,351.59 → $2,307.25
Upside Targets After Recovery: $2,538 → $2,574.54 → $2,627.42 → $2,668.81 → $2,784.60
📌 Final Outlook
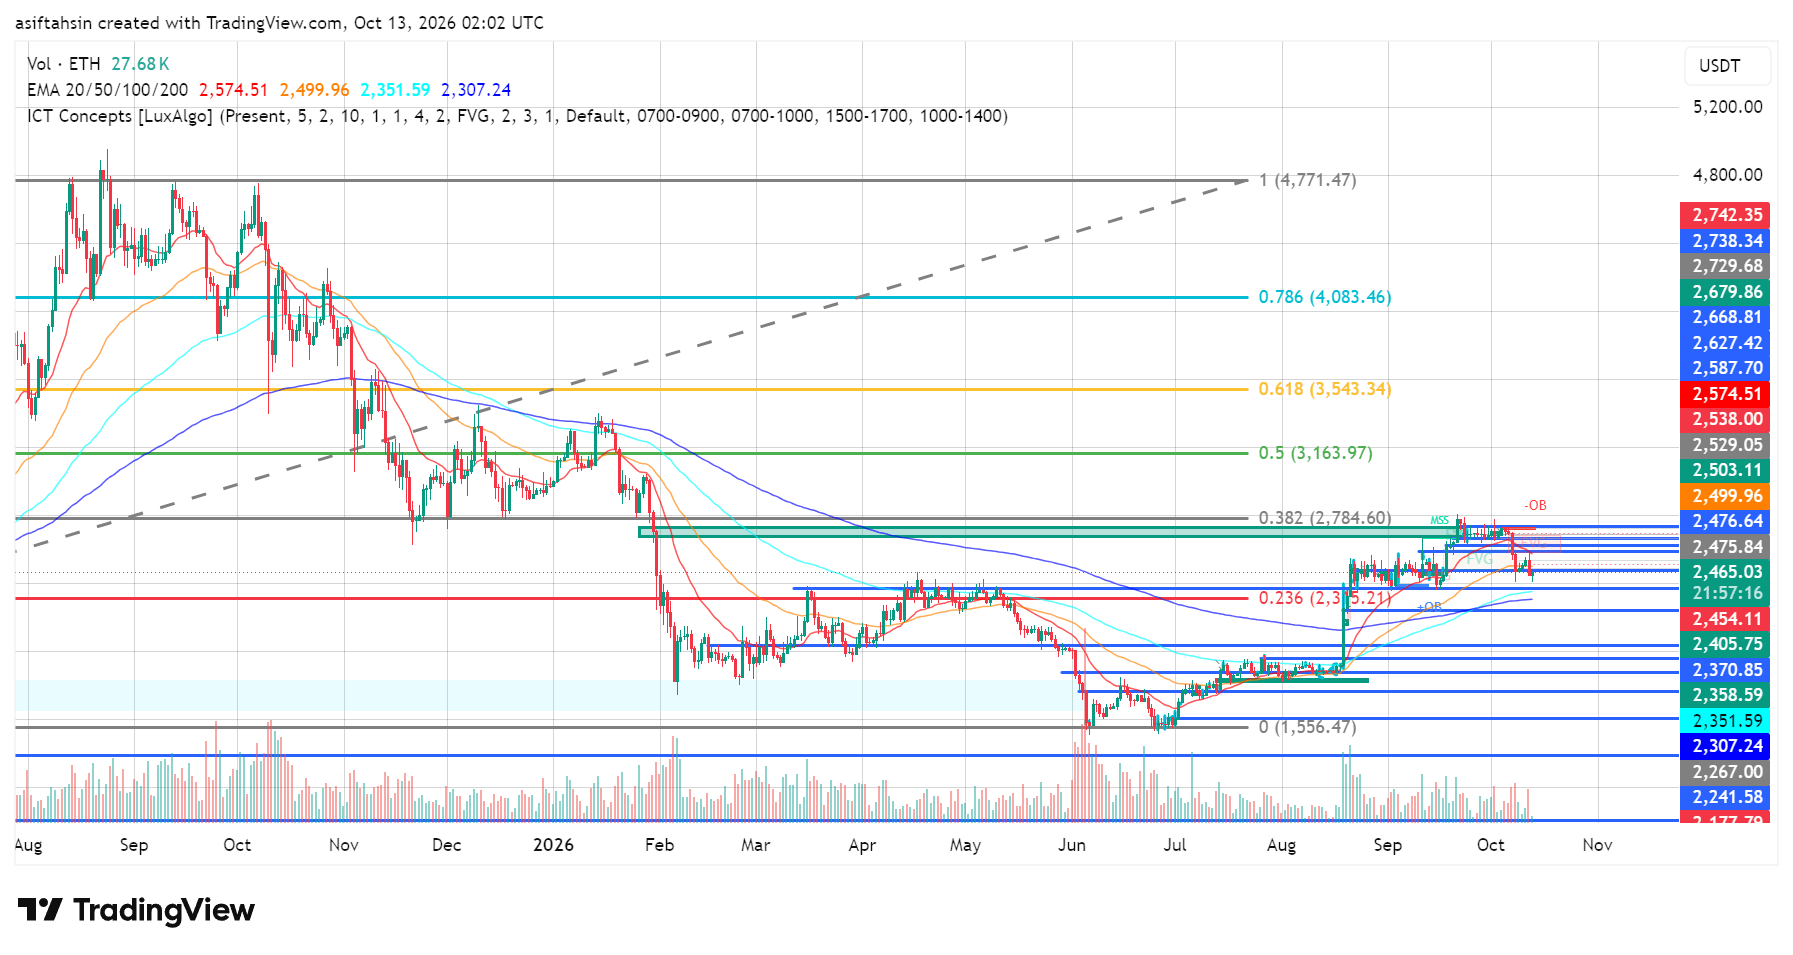
ETH is facing short-term bearish pressure after losing the 20 and 50 EMAs, while RSI confirms weakening momentum.
The key support zone is $2,405–$2,454.
If buyers defend this region and reclaim $2,500–$2,575, ETH could recover toward $2,627, $2,669 and eventually $2,784.60.
However, a decisive breakdown below $2,405 could expose $2,370–$2,351, followed by the 200 EMA near $2,307.
Bias: Short-term momentum remains bearish below $2,574.54. Holding $2,405–$2,454 could support a recovery, but a sustained break below $2,405 would increase downside risk toward $2,370 and $2,351.
