


Retail traders often buy at the top and sell at the bottom because they react to news instead of tracking smart money movement. Crypto whales—large institutional holders—leave clear footprints on technical charts long before a major price breakout occurs.
Here is a 3-step guide on how to spot whale accumulation early:
1️⃣ Aggressive Wick Defenses at Key Support
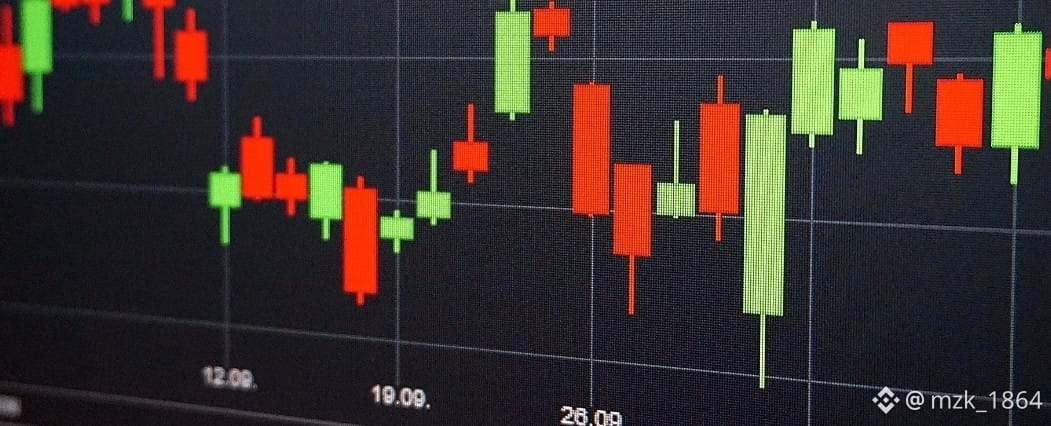
When price drops sharply into a major support zone (like $82,000–$82,800) but immediately forms long lower wicks on high volume, it indicates large buy-limit orders absorbing retail selling pressure.
2️⃣ Volume Divergence During Price Dips
If price makes a lower low but selling volume decreases significantly, sellers are becoming exhausted. When whale wallets buy into this low volume, it creates a subtle bullish divergence on key indicators like RSI.
3️⃣ Shrinking Range & Shrinking Volatility
Before a massive breakout, price range compresses into a tight channel while open interest cools down. Whales prefer accumulating quietly during low-volatility phases rather than chasing green candles during a pump.
🎯 Core Takeaway:
Follow price action structure instead of emotions. Patiently waiting for whale accumulation patterns near major demand levels will instantly raise your trade win-rate!
💬 Which indicator do you trust most for spotting market momentum? (RSI, MACD, or Volume?) Share your thoughts below!
#CryptoEducation #TradingTips #TechnicalAnalysis #BinanceSquare $BTC $ETH $SOL