

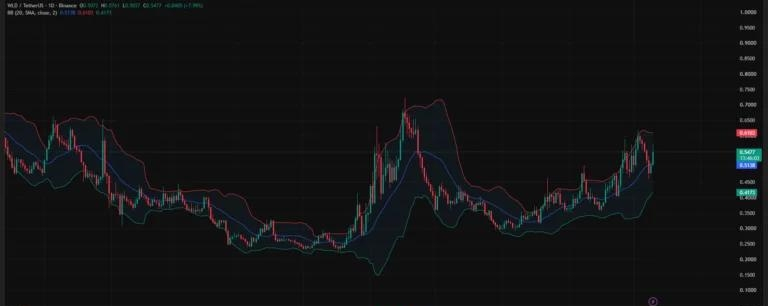

Worldcoin has rebounded above $0.51 after its sharp October sell-off, with WLD trading near $0.55 as the daily chart places the next major resistance around $0.61.
TradingView’s $WLD /USDT daily chart recorded Worldcoin at $0.5477 on Oct. 10, following a session high of $0.5761 and a low of $0.5037. The token was up 7.99% on the daily reading, although it had pulled back from its intraday peak.
The rebound followed a steep decline from an early-October high above $0.60. CoinGlass’s one-week liquidation heatmap traced a fall toward $0.46 late on Oct. 8 before WLD recovered through $0.48, $0.51 and $0.53.
At approximately $0.55, WLD had recovered about 19% from that low. However, TradingView’s daily and 4-hour charts still placed the token below its early-October peak, leaving the recovery short of a full reversal of the preceding decline.
Daily resistance sits near $0.61 as momentum slows
TradingView’s daily Bollinger Bands placed the upper boundary at $0.6103 and the lower boundary at $0.4173. WLD was trading in the upper half of that range after recovering the $0.5138 middle line.
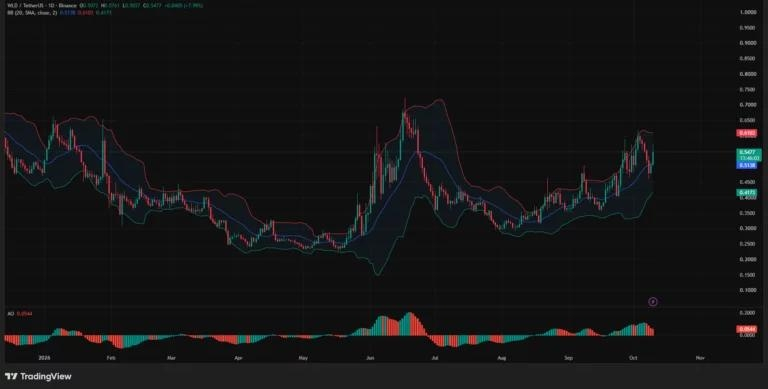
The upper band was approximately 11.4% above the recorded price of $0.5477. It also overlapped with the early-October trading area where the daily chart showed WLD reaching above $0.60 before retreating.
The same chart recorded the Awesome Oscillator at a positive 0.0544. Its latest histogram bars were red and shorter than the preceding green bars, showing that the positive momentum reading had weakened during the pullback.
Price and momentum therefore showed different aspects of the recovery: WLD had regained the Bollinger middle line, while the oscillator remained below its recent peak.
The daily chart also showed that October’s advance remained below June’s much higher price spike, which reached above $0.70. A return to the October high would still leave WLD beneath that earlier peak.
The 4-hour Supertrend turns bullish near $0.49
TradingView’s 4-hour chart recorded WLD at $0.5482 and displayed a fresh green Supertrend reading at $0.4864 following the sharp rebound.
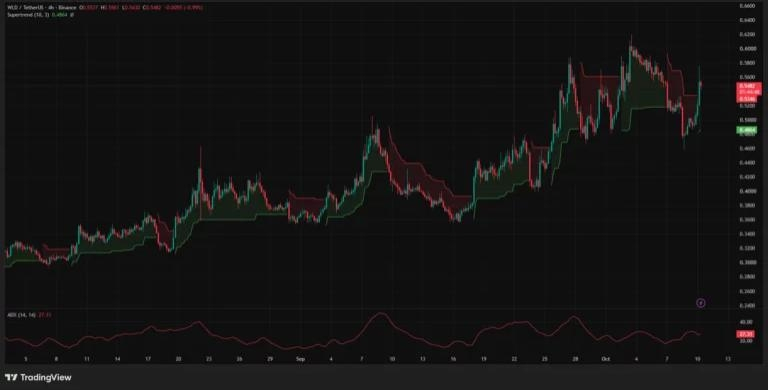
The preceding red Supertrend segment stood around $0.5346, below the latest price. The recovery had crossed that segment as WLD climbed from the recent lows toward $0.55.
The green Supertrend level was approximately 11.3% below the recorded 4-hour price. It sat close to the $0.48 base, placing two separate technical references in the same lower price area.
The 4-hour Average Directional Index stood at 27.31. ADX measures trend strength rather than direction; the chart’s bullish direction signal came from the green Supertrend.
TradingView’s latest 4-hour price sequence also showed a pullback after the initial surge. WLD traded below the rebound’s highest wick, while remaining above the previous red Supertrend level.