

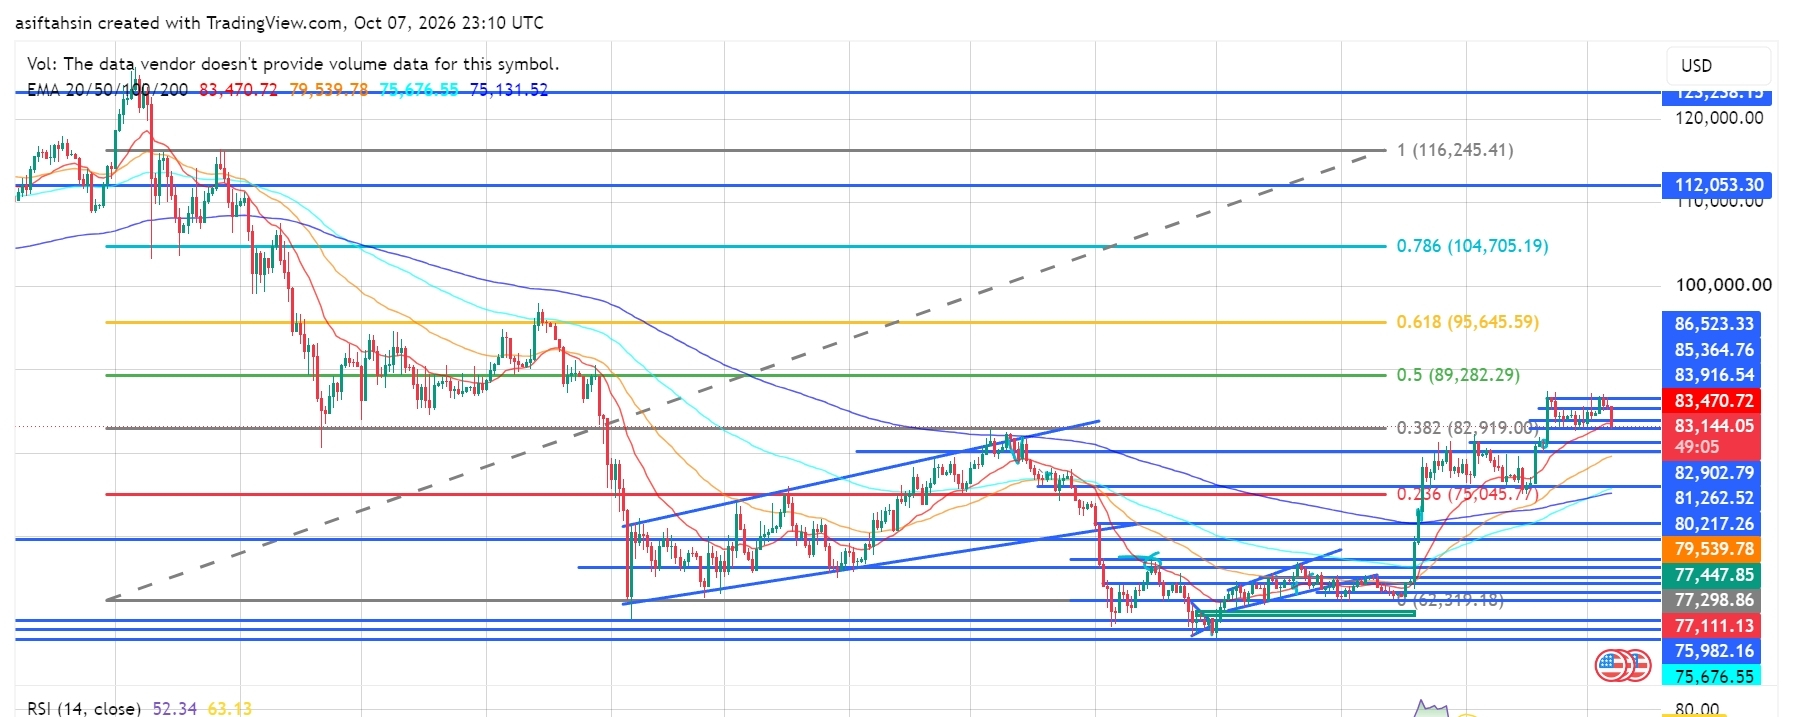

BTC is currently trading around $83,470, holding just above the $82.9K–$83K region after rejecting the recent $86K–$87K resistance area.
The larger recovery structure remains intact, but short-term momentum has cooled. BTC is now testing the 0.382 Fibonacci level at $82,919, making this an important decision zone for the next move.
📈 EMA Structure
20 EMA: $83,470.72
50 EMA: $79,539.78
100 EMA: $75,676.55
200 EMA: $75,131.52
BTC is currently sitting directly around the 20 EMA, while the 20 EMA remains well above the 50, 100 and 200 EMA.
This keeps the broader recovery structure constructive, but BTC needs to reclaim the $84K–$85K area to regain stronger short-term momentum.
The $79.54K 50 EMA remains an important deeper support.
📐 Fibonacci Levels
0.236: $75,045.77
0.382: $82,919.00
0.5: $89,282.29
0.618: $95,645.59
0.786: $104,705.19
1.0: $116,245.41
1.272: $130,913.34
BTC is currently trading just above the 0.382 Fibonacci level at $82,919.
Holding this level and reclaiming the nearby resistance zone could restore the bullish continuation setup toward $89,282.
🟢 Bullish Scenario
Immediate resistance is positioned around:
$83,916 → $85,365 → $86,523
A clean breakout and sustained close above $86.5K could signal that buyers are regaining control.
The next major upside targets would be:
$89,282 → $95,645 → $104,705 → $112,053 → $116,245 → $123,238
The $89,282 0.5 Fibonacci level is the first major upside objective after a successful breakout.
🔴 Pullback Scenario
Key support levels:
$82,919 → $82,903 → $81,262 → $80,217 → $79,540 → $77,448 → $77,299 → $77,111 → $75,982
The $82.9K area is especially important because it is both the 0.382 Fibonacci level and a major structural support.
If BTC holds $82.9K and forms a higher low, the current move can simply be viewed as a retest.
A sustained break below $81.26K would weaken the short-term structure and could expose the $80.21K–$79.54K region.
🧠 Market Structure & Liquidity
The broader structure can be viewed as:
Liquidity Sweep → Accumulation → Higher Lows → Breakout → Expansion → Retest → Consolidation → Continuation
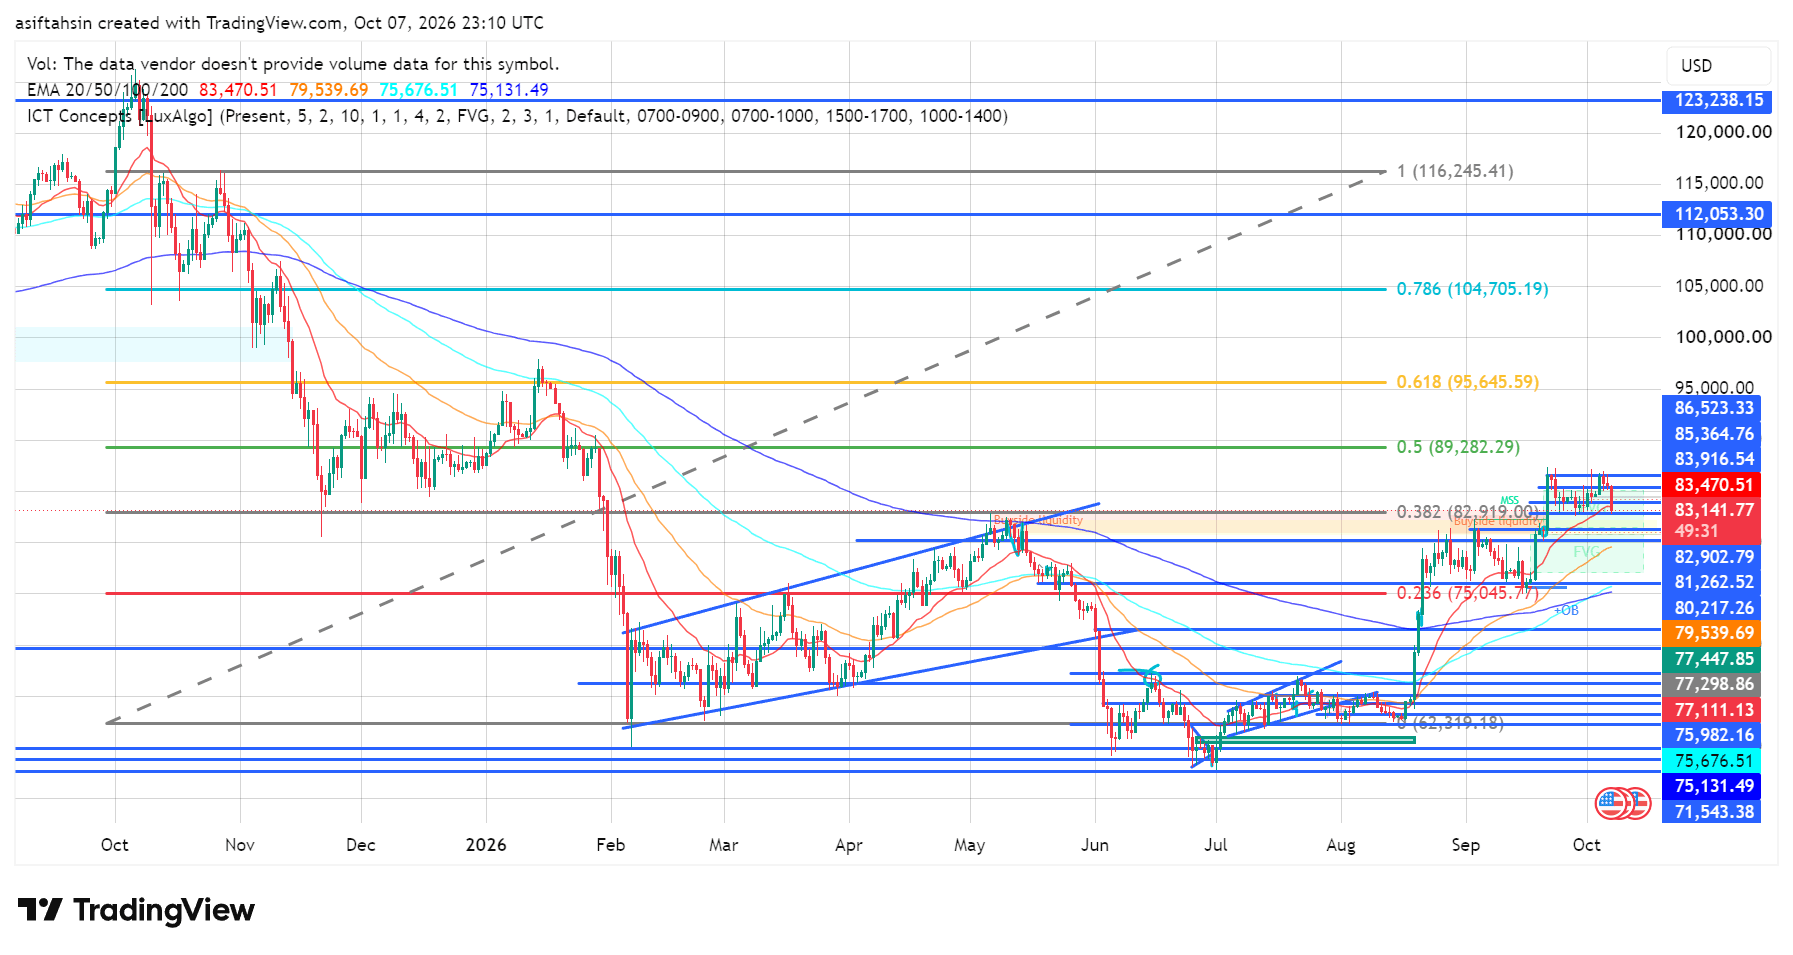
BTC swept liquidity around $62.3K, built a long accumulation structure, established higher lows and then expanded sharply higher.
After reaching the $85K–$87K area, price is now consolidating and pulling back toward the $82.9K Fibonacci support.
The key question is whether this becomes a healthy retest or the beginning of a deeper correction.
📊 RSI Momentum
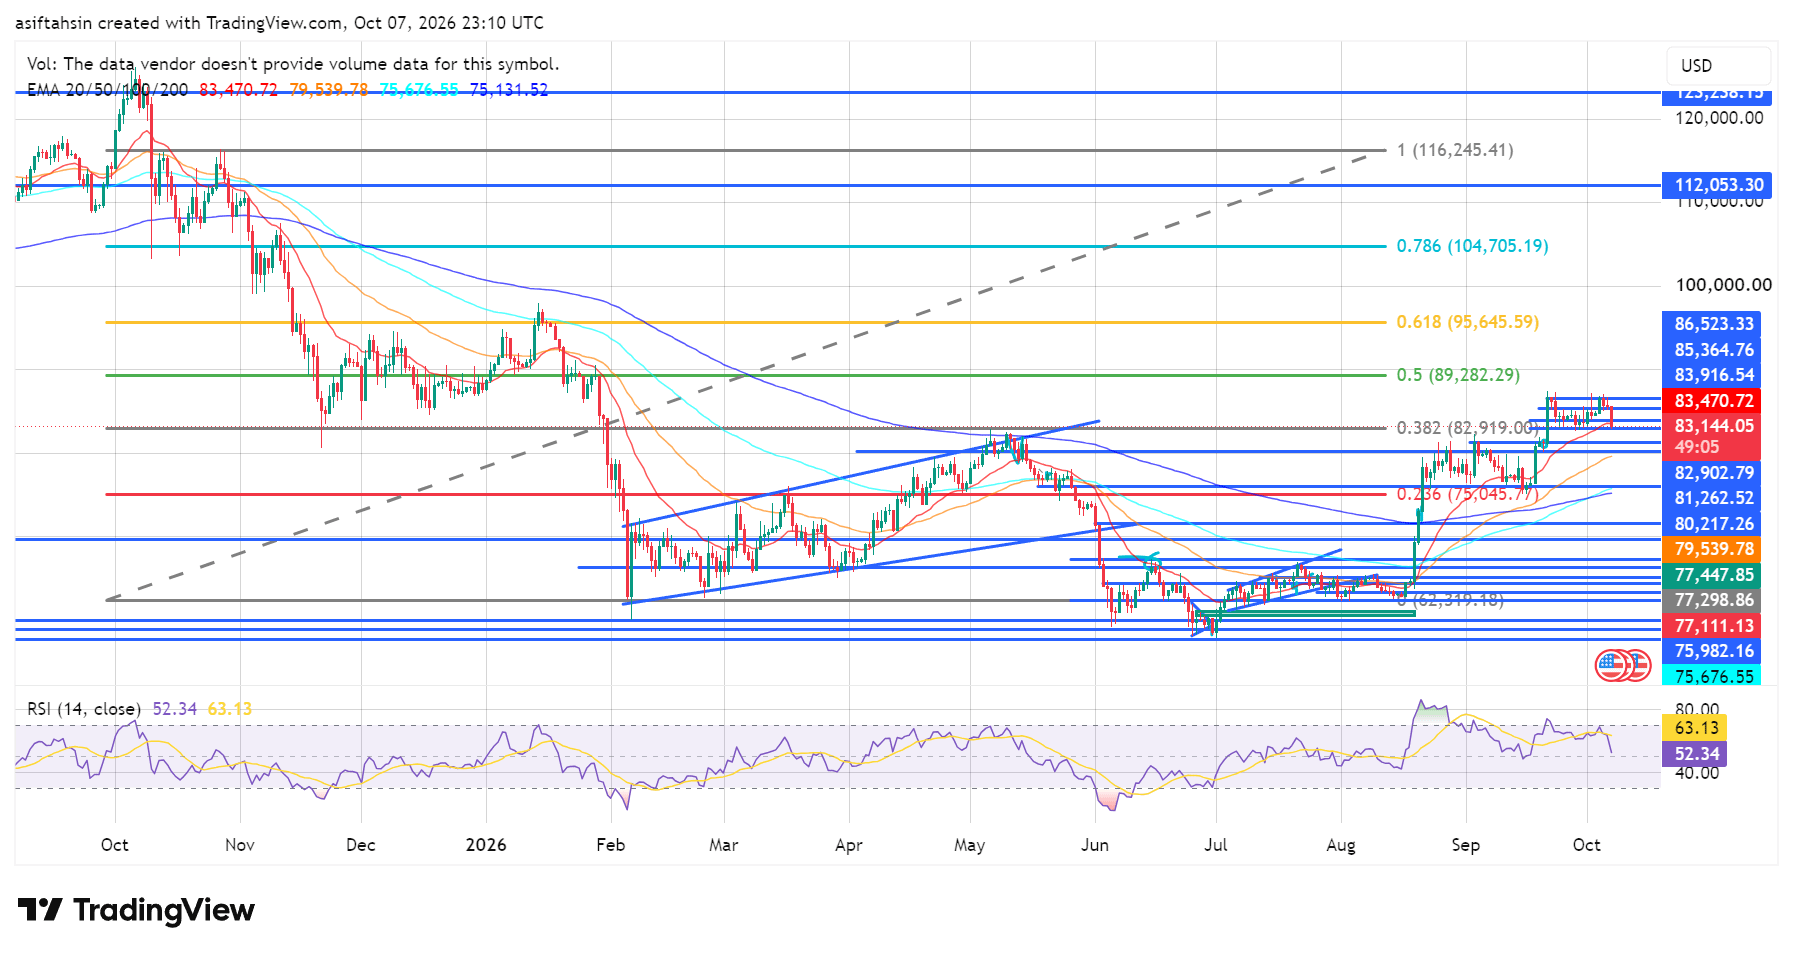
RSI: 52.34
RSI MA: 63.13
RSI has cooled significantly from the previous elevated levels and is now near the neutral 50 zone.
This shows that short-term momentum has weakened, but RSI has not entered an extreme oversold condition. A recovery back above 60 would strengthen the bullish momentum again.
🎯 Key Levels
Resistance:
$83,916 → $85,365 → $86,523 → $89,282 → $95,645
Support:
$82,919 → $81,262 → $80,217 → $79,540 → $77,448
Major EMA Support:
$83,471 → $79,540 → $75,677 → $75,132
Major Upside Levels:
$89,282 → $95,645 → $104,705 → $112,053 → $116,245
📌 Final Outlook
BTC remains in a larger recovery structure, but the short-term chart has entered a critical retest phase.
The most important area is $82.9K.
If BTC holds $82,919 and reclaims $85,365–$86,523, the structure can strengthen again toward $89,282, followed by $95,645 and $104,705.
On the downside, losing $82.9K would increase the probability of a move toward $81,262, $80,217 and $79,540.
Bias: Recovery structure remains constructive above $82,919. Sustained strength above $86,523 could reopen the path toward $89,282, $95,645 and $104,705 next.
