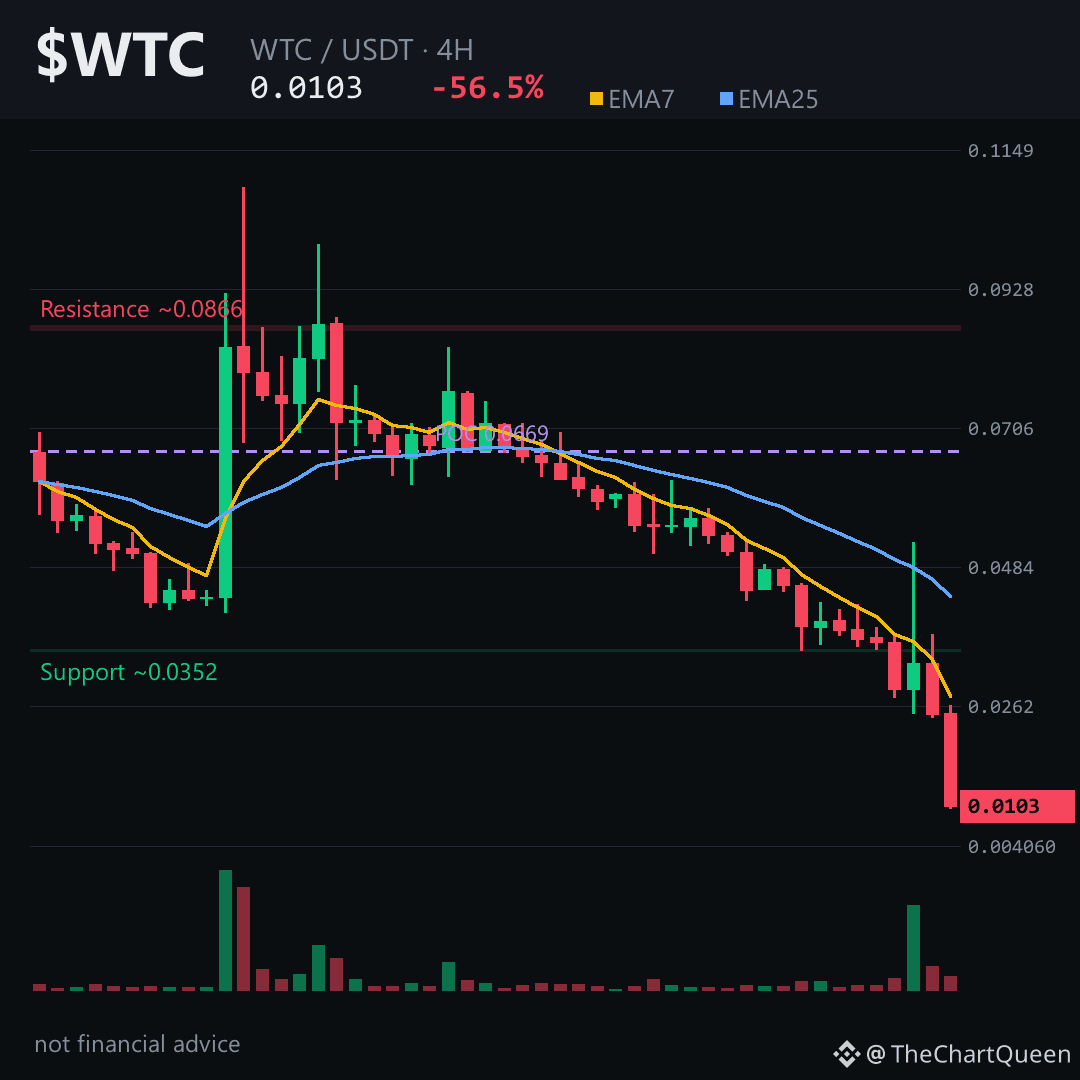
0.0103 – the price just slipped below its 4‑hour pivot, and the next candle could decide if $WTC slides into the low‑9‑cent zone. 👀
A bearish EMA cross, RSI stuck in the 20s and nine reds out of twelve candles whisper a hidden trap beneath the current area.
On the 4‑hour chart the pivot sits around 0.01035. Lose that zone on a closed candle and the price may drift toward the ~0.0094 objective. The line in the sand sits near 0.01087 – a clear invalidation; a bounce above it would wipe the bearish thesis. Funding is flat, so neither longs nor shorts are paying a premium, reinforcing the lack of conviction on the upside.
My read: the chart is nudging $WTC lower, and the real risk is a break beneath the ~0.01035 pivot.
If you want to watch the next move, hit follow – I’ll break down the next swing as soon as the price tests the ~0.0094 zone. What do you think $WTC will do around the ~0.0103 area? 👇
⚠️ Not financial advice. DYOR.
#WTC #Worldcoin #Crypto #BinanceSquare
A bearish EMA cross, RSI stuck in the 20s and nine reds out of twelve candles whisper a hidden trap beneath the current area.
On the 4‑hour chart the pivot sits around 0.01035. Lose that zone on a closed candle and the price may drift toward the ~0.0094 objective. The line in the sand sits near 0.01087 – a clear invalidation; a bounce above it would wipe the bearish thesis. Funding is flat, so neither longs nor shorts are paying a premium, reinforcing the lack of conviction on the upside.
My read: the chart is nudging $WTC lower, and the real risk is a break beneath the ~0.01035 pivot.
If you want to watch the next move, hit follow – I’ll break down the next swing as soon as the price tests the ~0.0094 zone. What do you think $WTC will do around the ~0.0103 area? 👇
⚠️ Not financial advice. DYOR.
#WTC #Worldcoin #Crypto #BinanceSquare