

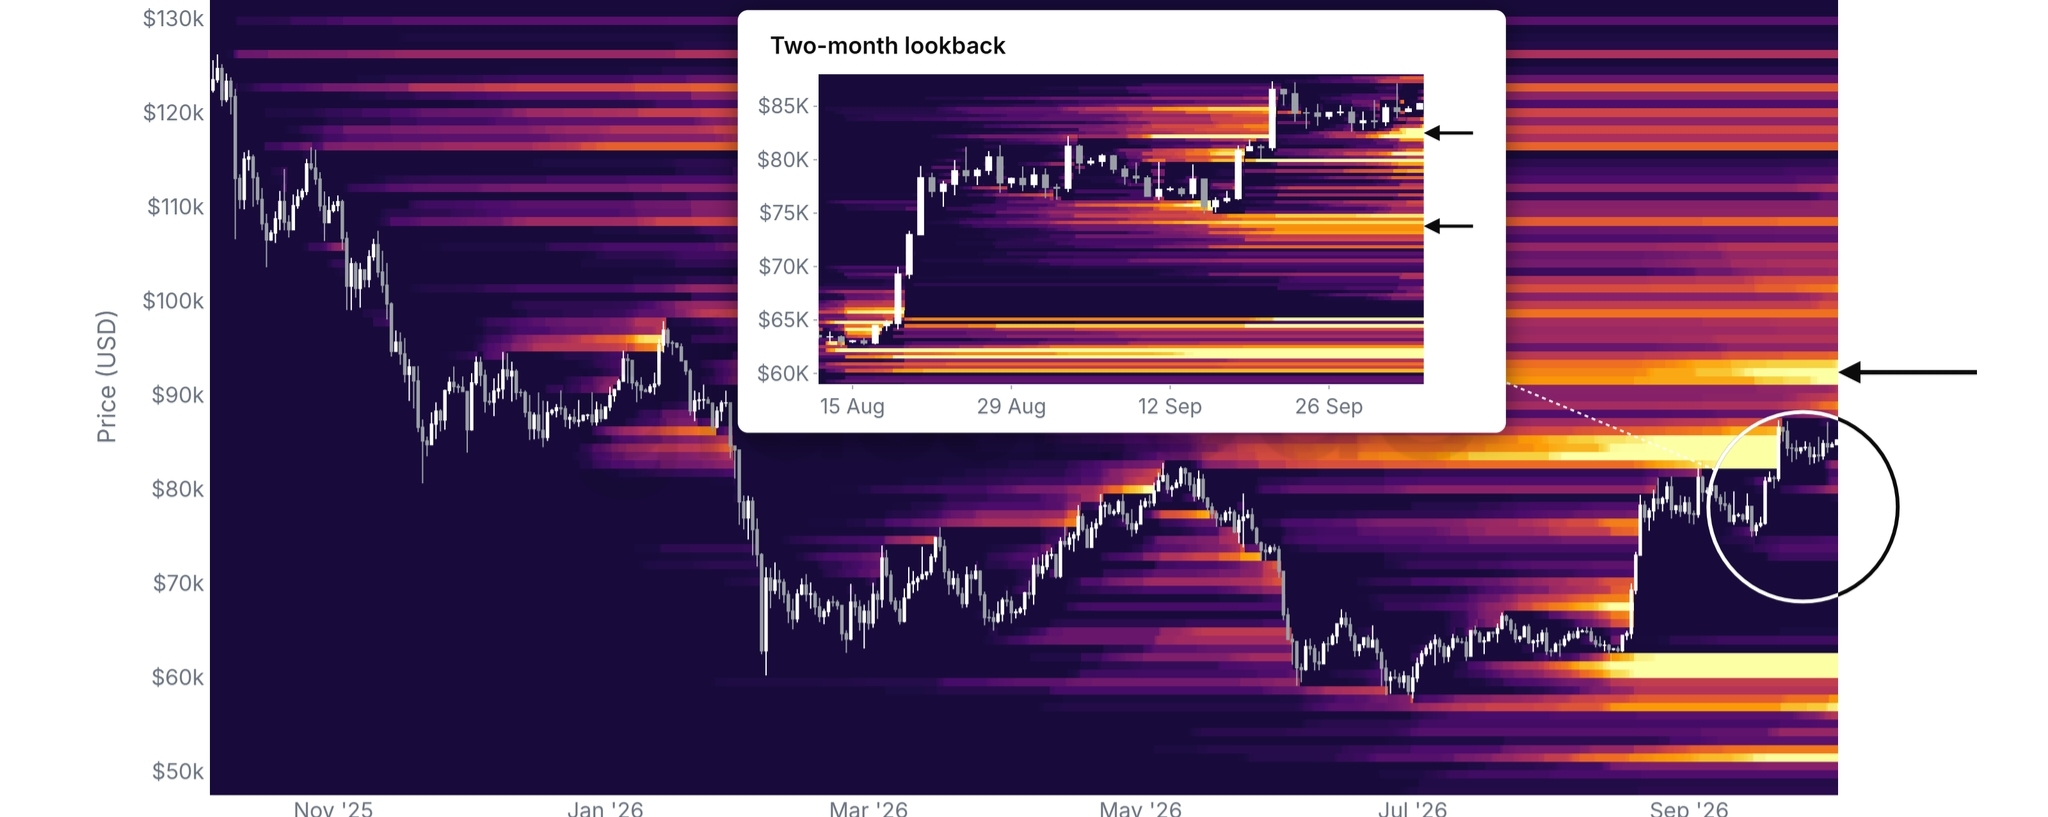

Glassnode's heatmap shows Bitcoin's largest overhead liquidation cluster sitting near $90,000. Enough leveraged short exposure stacked there that touching it could force a real squeeze.
Smaller clusters sit at $83,000 and $75,000.
Here's the part worth separating from that setup though.
In the past 24 hours, actual liquidations hit $172 million. Longs lost $101 million of that. Shorts lost $71 million. The pain right now is landing harder on longs, not shorts. The opposite of what the exciting $90K story implies.
I think that distinction is worth sitting with.
The $90K squeeze is a real, mapped setup. But it's describing what happens if price gets there. The liquidations happening today are telling you something different, what's happening on the way there. And right now that's longs getting forced out, which is part of why Bitcoin keeps failing to reach that level in the first place.
Worth connecting this to the rejection pattern too, since it's the same story underneath.
Bitcoin's been turned back from $87,000 three times since September 23. Before the market can even test the $90K short-liquidation zone, it still has to clear the 2026 yearly open at $87,570, sitting right above current price near $85,500.
So there are really two walls here.
The near one, $87,570, is where price keeps actually failing. The far one, $90,000, is where the bigger squeeze theoretically sits once the near wall clears.
I'm not dismissing the $90K setup. If price does break through, that cluster is real and could add real momentum.
Just noting the squeeze everyone's excited about is still one wall away, and today's liquidation data shows longs are the ones actually bleeding while getting there.$BTC