Key Price Drivers for BNB
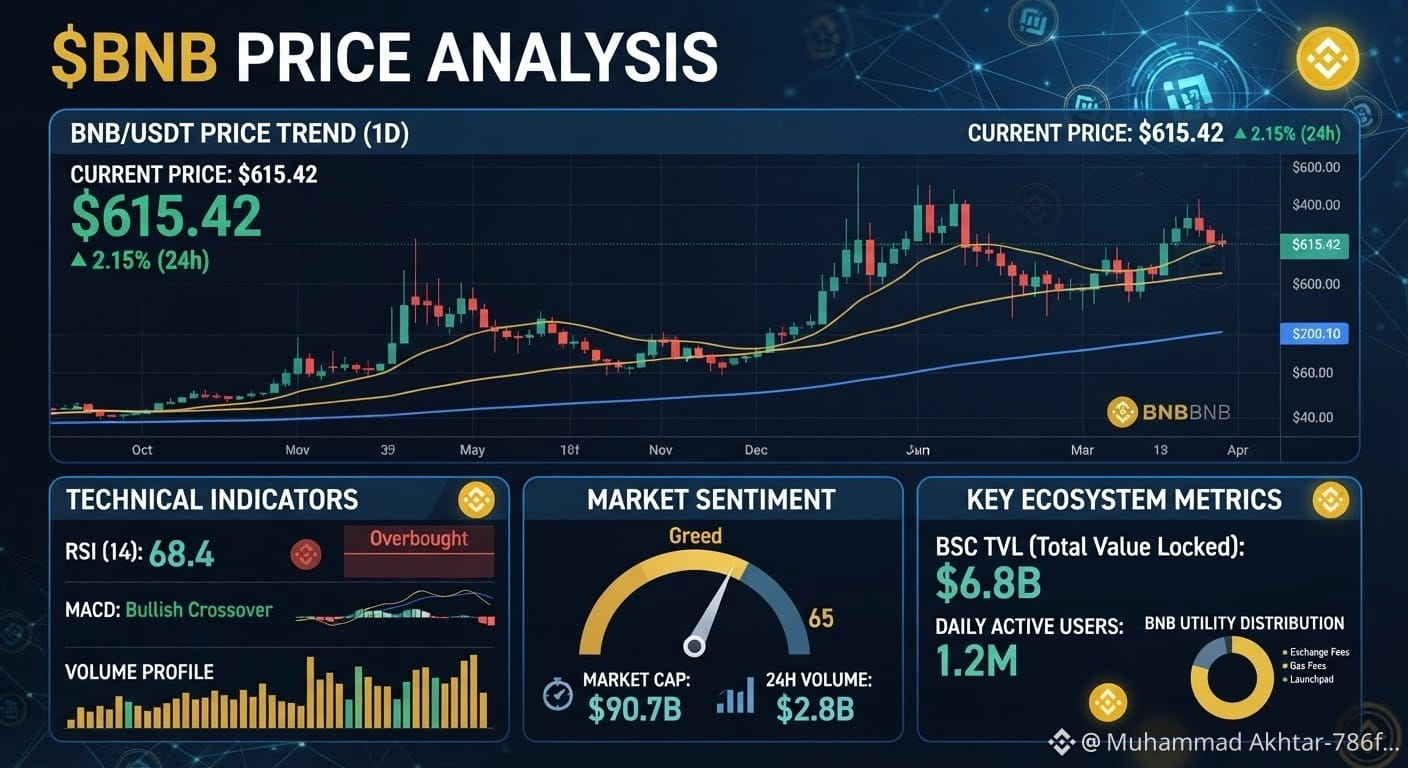
Utility & Ecosystem Demand: BNB powers the Binance Smart Chain (BSC) network as gas fees, provides trading fee discounts on the Binance exchange, and is regularly utilized in Launchpool token offerings. Higher on-chain activity directly increases demand and token burn rates.
Quarterly Auto-Burns: Binance's systematic token burn mechanism steadily reduces the total circulating supply over time, creating a deflationary pressure model that historically supports long-term valuation floors.
Broader Market Correlation: BNB typically correlates with Bitcoin ($BTC) and Ethereum ($ETH) market trends, often reacting to macro liquidity shifts, regulatory updates, and overall crypto market sentiment.
Technical Analysis Framework
When evaluating BNB charts, traders generally look at the following key zones:
Indicator Type
What to Look For
Interpretation
Moving Averages (MA)
50-day and 200-day MAs
Determines macro trend direction (Bullish if price is trading above key long-term averages).
Relative Strength Index (RSI)
14-period RSI
Identifies overbought conditions (>70) or oversold conditions (<30).
Support & Resistance
Historical volume profile nodes
Key psychological price levels where buying or selling pressure historically spikes.
$BNB #ETHUp70%InQ3ButLiquidityFalls #FedOctoberHoldOdds82.3% #DriftHackVictimsBeginClaims
Utility & Ecosystem Demand: BNB powers the Binance Smart Chain (BSC) network as gas fees, provides trading fee discounts on the Binance exchange, and is regularly utilized in Launchpool token offerings. Higher on-chain activity directly increases demand and token burn rates.
Quarterly Auto-Burns: Binance's systematic token burn mechanism steadily reduces the total circulating supply over time, creating a deflationary pressure model that historically supports long-term valuation floors.
Broader Market Correlation: BNB typically correlates with Bitcoin ($BTC) and Ethereum ($ETH) market trends, often reacting to macro liquidity shifts, regulatory updates, and overall crypto market sentiment.
Technical Analysis Framework
When evaluating BNB charts, traders generally look at the following key zones:
Indicator Type
What to Look For
Interpretation
Moving Averages (MA)
50-day and 200-day MAs
Determines macro trend direction (Bullish if price is trading above key long-term averages).
Relative Strength Index (RSI)
14-period RSI
Identifies overbought conditions (>70) or oversold conditions (<30).
Support & Resistance
Historical volume profile nodes
Key psychological price levels where buying or selling pressure historically spikes.
$BNB #ETHUp70%InQ3ButLiquidityFalls #FedOctoberHoldOdds82.3% #DriftHackVictimsBeginClaims