



As of October 5, 2026, the FET price trades at $0.2596 on Binance, above every major daily moving average. The daily trend is unambiguously bullish: RSI is climbing and the MACD histogram just flipped positive. The tension lies in shorter timeframes, where momentum is already cooling while structure holds.
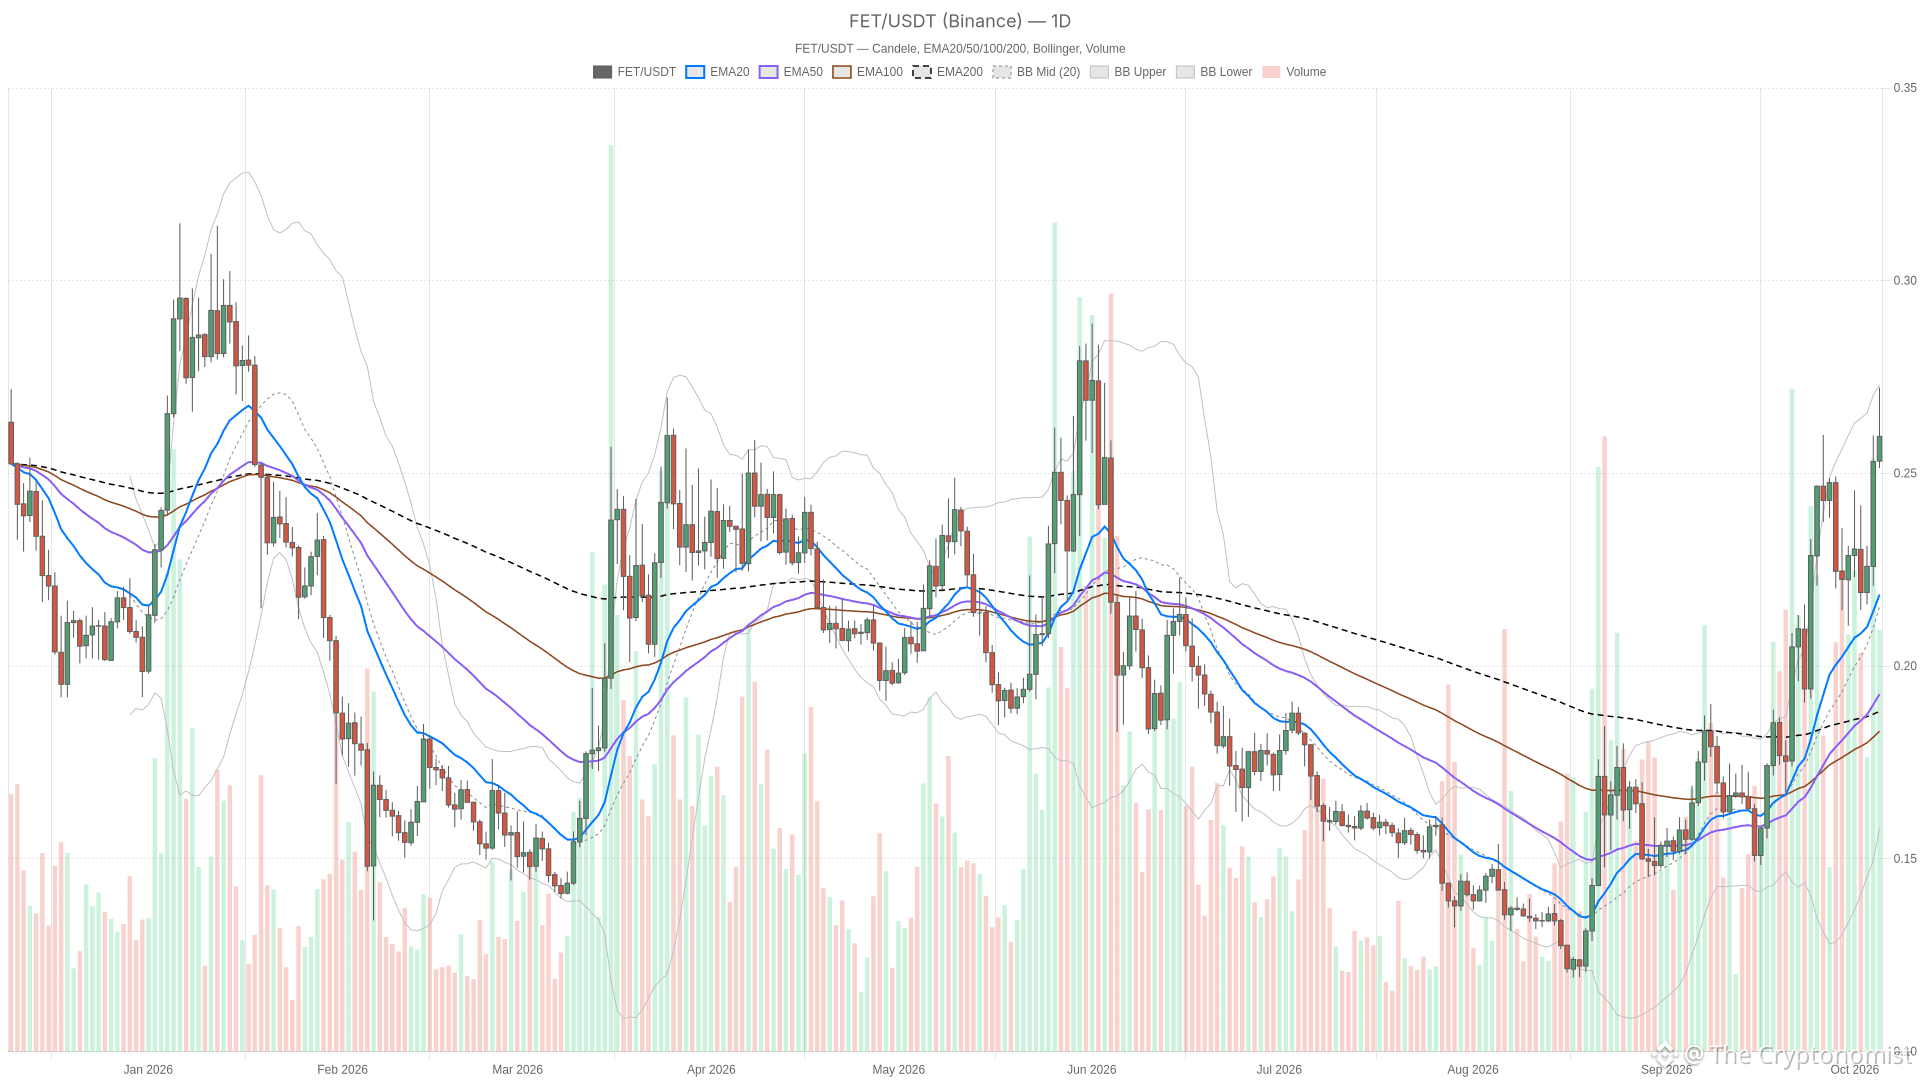 FET/USDT — daily chart with candlesticks, EMA20/EMA50 and volume.
Key takeaways
FET at $0.2596 sits above the daily EMA20, EMA50, and EMA200 in a textbook bullish alignment.
Daily RSI at 67.0 and a newly positive MACD histogram confirm the uptrend, while hourly momentum tells a different story.
Total crypto market cap stands at $2.91 trillion, down 2.74% in 24 hours, with Bitcoin dominance at 59.23%.
A daily close above $0.2684 would open the path toward $0.2703; an hourly close below $0.2593 signals a deepening pullback.
The Fear & Greed Index reads 70, firmly in Greed territory per Alternative.me.
Broader Market Cools While FET Price Pushes Against Resistance
The broader crypto market is contracting even as FET pushes against resistance near $0.2684, with total market capitalization down 2.74% to $2.91 trillion over the past 24 hours.
Total crypto market capitalization sits at $2.91 trillion, down 2.74% over the past 24 hours, according to CoinGecko. Bitcoin dominance is at 59.23%, also per CoinGecko. The Fear & Greed Index, tracked by Alternative.me, reads 70, in Greed territory. That combination — elevated sentiment alongside contracting total capitalization — does not necessarily favor altcoins pushing into resistance, since broader liquidity is not confirming the move. The move looks more like an asset-specific push than something riding a market-wide tailwind.
Daily Structure: EMAs Aligned Bullish, But Not Everywhere
The daily EMA structure is unambiguously bullish, with price above all three major moving averages stacked in textbook order — EMA20 above EMA50 above EMA200.
On the daily chart, price sits above the EMA20 ($0.2142), EMA50 ($0.1900), and EMA200 ($0.1876), with the EMA order confirming the medium-term uptrend without ambiguity. The hourly chart tells the same structural story — price above all three EMAs ($0.2554, $0.2445, $0.2324), with the same bullish stacking.
The 15-minute chart keeps the bullish EMA order too, but price itself is mixed against it. It sits below the 15-minute EMA20 ($0.2616), yet still above the EMA50 ($0.2588) and EMA200 ($0.2444). That is a short-term wobble inside a longer-term uptrend, not a reversal signal on its own. It does mean the very short-term tape is more fragile than the daily chart suggests.
Momentum Diverges: Daily RSI Climbs While Hourly MACD Fades
Daily momentum indicators align with the bullish trend. RSI at 67.0 is climbing and the MACD histogram just turned positive. Hourly indicators, meanwhile, show momentum fading, creating a divergence between timeframes.
Daily RSI sits at 67.0, up from 57.4 and 59.6 over the prior two closed candles — a clear climb, though still short of overbought territory. The daily MACD histogram just crossed from negative to positive, flipping from -0.0003 to +0.00086 across the last three closed candles. This lines up with the bullish regime read.
The hourly chart, meanwhile, breaks from that script. RSI there reads 62.4, but the three-candle sequence (66.9 → 59.8 → 62.4) is mixed rather than trending in either direction. The hourly MACD histogram crossed from positive to negative and is now fading, moving from +0.00022 to -0.00016 to -0.00025 across the last three closed candles. Momentum is losing steam right as price stalls below the hourly pivot.
On the 15-minute chart, the histogram is still negative but narrowing (-0.00062 → -0.00045 → -0.00042). RSI is easing from 53.2 to 51.3 — not a breakdown, just a loss of short-term thrust. Bollinger Bands add context: the daily bands run from $0.1497 to $0.2703 with a mid-band at $0.2100, meaning price is comfortably inside the upper half of its range. Daily ATR stands at roughly $0.0207, a wide band relative to current price that flags moves of a cent or two in either direction as normal noise. The hourly ATR, near $0.0066, is proportionally similar, reinforcing that the recent pullback from $0.2632 to $0.2594 sits well within typical volatility rather than signaling a trend change.
Key Levels: $0.2684 Caps the Upside, $0.2446 Is the Level That Matters on a Drop
Resistance sits at $0.2684 (daily R1), while the critical support cluster lies at $0.2446, where the daily pivot, hourly Bollinger lower band, and hourly EMA50 converge.
The nearest level above current price is the daily R1 at $0.2684, which coincides with the hourly Bollinger upper band at the same value. The daily Bollinger upper band sits at $0.2703. Below price, the hourly S1 at $0.2593 is essentially where the market sits right now, with the hourly pivot at $0.2617 just overhead. Further down, the daily pivot at $0.2446 lines up with both the hourly Bollinger lower band and the hourly EMA50 at the same level. That makes the zone a more meaningful cluster than any single indicator would suggest on its own.
Bullish scenario: a daily close above the daily R1 at $0.2684 would open room toward the daily Bollinger upper band at $0.2703. It would also resolve the current hourly momentum stall in the bulls’ favor. This scenario would be invalidated by a daily close back below the daily pivot at $0.2446. That would undercut the entire short-term structure built since the last completed daily candle.
Bearish scenario: an hourly close below the hourly S1 at $0.2593 — a level price is already brushing against — would signal the hourly pullback is deepening rather than consolidating. That reading would be invalidated by an hourly close back above the hourly pivot at $0.2617. That would put the hourly chart back in line with the still-bullish daily trend.
The real risk is treating the hourly MACD fade as a trend reversal when the daily structure, EMA order, and RSI are still pointing up. The more honest read is that the asset is in a daily uptrend taking a short-term breather. The next few hourly closes around $0.2593–$0.2617 will say more than any single indicator can.
FAQ
What is FET doing right now?
FET trades at $0.2596 on Binance, above its daily EMA20, EMA50 and EMA200, after the last completed daily candle closed at $0.2531.
Is FET’s daily trend bullish or bearish?
The daily regime reads bullish: price sits above all three daily EMAs in a textbook bullish order, daily RSI is at 67.0 and climbing, and the daily MACD histogram just crossed into positive territory.
Why does the hourly chart look weaker than the daily chart?
The hourly MACD histogram has crossed from positive to negative and is fading, and hourly RSI at 62.4 is moving in a mixed pattern rather than trending. Price is also hovering right at the hourly S1 of $0.2593, just under the hourly pivot at $0.2617.
What would confirm a bullish continuation?
A daily close above the daily R1 at $0.2684 would point toward the daily Bollinger upper band at $0.2703, provided it is not immediately followed by a daily close back below the daily pivot at $0.2446.
Disclaimer: This article is for informational purposes only and does not constitute financial advice, an investment recommendation, or a solicitation to buy or sell any financial instrument or cryptocurrency. The analysis provided is not indicative of future results. Investing in crypto assets and financial markets carries a high risk of capital loss. Always do your own research (DYOR) and consult a qualified financial advisor before making any decision.
Article produced with the assistance of artificial intelligence and reviewed by the editorial team.