DAILY SIGNAL — SOL/USDT
Date: 05 Oct 2026 Timeframe: 1m Intraday Bias: Support test → potential downside continuation
📊 Market Bias
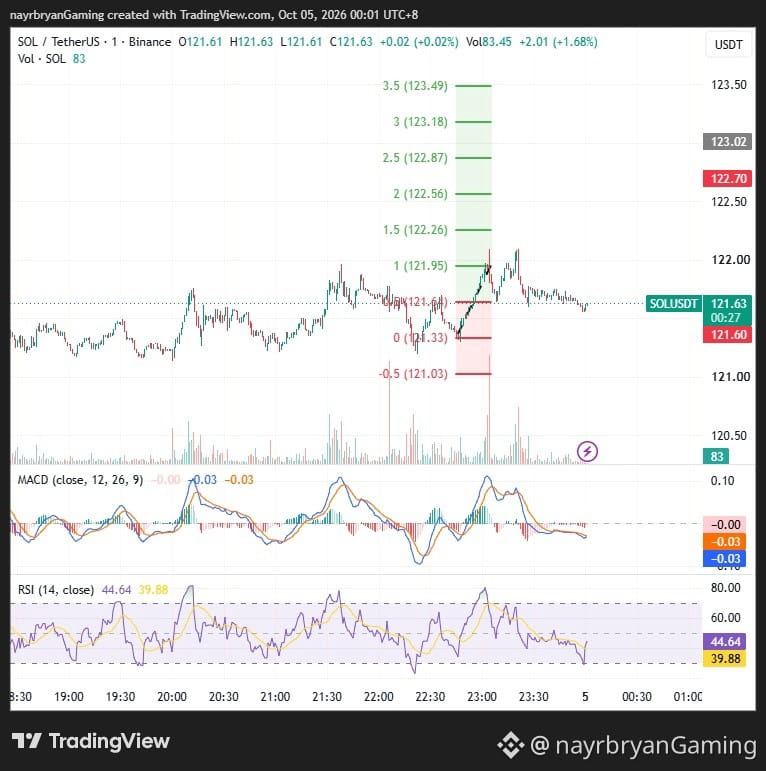
SOL is trading around 121.54 after rejecting the upper part of the recent ascending channel.
Price previously pushed toward the 121.95 Fibonacci level before reversing and drifting back toward the purple support/resistance zone.
The current structure is testing the lower side of that zone while momentum indicators remain weak.
🔹 Key Levels From Chart
Current Price: 121.54
Key Zone: 121.48 – 121.60
Key Support: 121.33
Lower Invalidation / Downside: 121.03
Bullish Reclaim: 121.95
🎯 Fibonacci Levels
Downside:
TP1 → 121.33 (0 Fib) TP2 → 121.03 (-0.5 Fib)
Upside:
TP1 → 121.95 (1.0 Fib) TP2 → 122.26 (1.5 Fib) TP3 → 122.56 (2.0 Fib) TP4 → 122.87 (2.5 Fib) TP5 → 123.18 (3.0 Fib) TP6 → 123.49 (3.5 Fib)
📈 Technical Breakdown
SOL remains inside a rising channel, but the latest price action shows rejection after the move toward 121.95.
Price has returned to the 121.48–121.60 zone, making this area important for the next short-term move.
MACD is below the zero line with bearish momentum visible.
RSI is around 32.35, showing weak momentum and approaching oversold territory.
If SOL loses 121.33, downside continuation toward 121.03 becomes the primary bearish structure to watch.
If SOL reclaims 121.95, the bearish setup weakens and the upper Fibonacci levels become relevant.
🧠 Quick Insight
“When momentum fades at resistance, support becomes the real test.”
⚠️ Disclaimer
This is personal market analysis, not financial advice. This chart framework is for educational purposes only.
Always DYOR / DYODD, manage risk properly, and avoid emotional trading.
— @nayrbryanGaming #SOL #SOLUSDT #Crypto #Trading #TechnicalAnalysis #PriceAction #Fibonacci #Binance #DYOR #NFA #NoFOMO
Date: 05 Oct 2026 Timeframe: 1m Intraday Bias: Support test → potential downside continuation
📊 Market Bias
SOL is trading around 121.54 after rejecting the upper part of the recent ascending channel.
Price previously pushed toward the 121.95 Fibonacci level before reversing and drifting back toward the purple support/resistance zone.
The current structure is testing the lower side of that zone while momentum indicators remain weak.
🔹 Key Levels From Chart
Current Price: 121.54
Key Zone: 121.48 – 121.60
Key Support: 121.33
Lower Invalidation / Downside: 121.03
Bullish Reclaim: 121.95
🎯 Fibonacci Levels
Downside:
TP1 → 121.33 (0 Fib) TP2 → 121.03 (-0.5 Fib)
Upside:
TP1 → 121.95 (1.0 Fib) TP2 → 122.26 (1.5 Fib) TP3 → 122.56 (2.0 Fib) TP4 → 122.87 (2.5 Fib) TP5 → 123.18 (3.0 Fib) TP6 → 123.49 (3.5 Fib)
📈 Technical Breakdown
SOL remains inside a rising channel, but the latest price action shows rejection after the move toward 121.95.
Price has returned to the 121.48–121.60 zone, making this area important for the next short-term move.
MACD is below the zero line with bearish momentum visible.
RSI is around 32.35, showing weak momentum and approaching oversold territory.
If SOL loses 121.33, downside continuation toward 121.03 becomes the primary bearish structure to watch.
If SOL reclaims 121.95, the bearish setup weakens and the upper Fibonacci levels become relevant.
🧠 Quick Insight
“When momentum fades at resistance, support becomes the real test.”
⚠️ Disclaimer
This is personal market analysis, not financial advice. This chart framework is for educational purposes only.
Always DYOR / DYODD, manage risk properly, and avoid emotional trading.
— @nayrbryanGaming #SOL #SOLUSDT #Crypto #Trading #TechnicalAnalysis #PriceAction #Fibonacci #Binance #DYOR #NFA #NoFOMO