


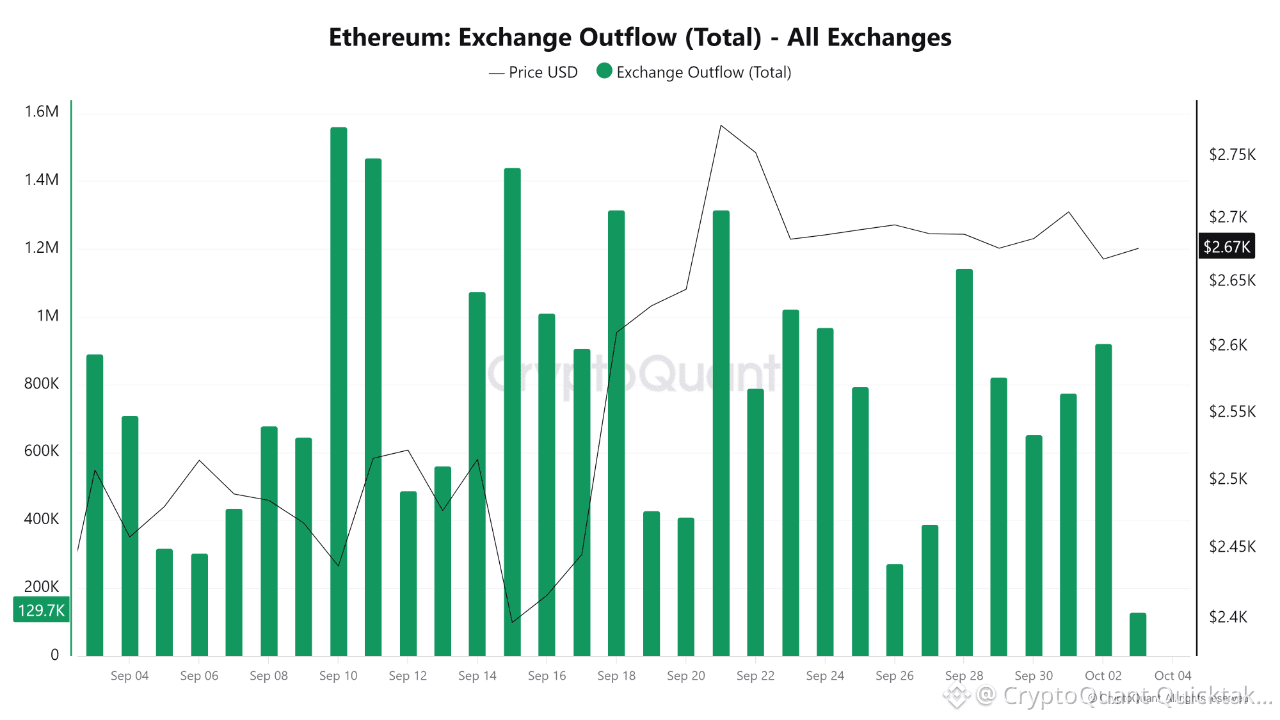
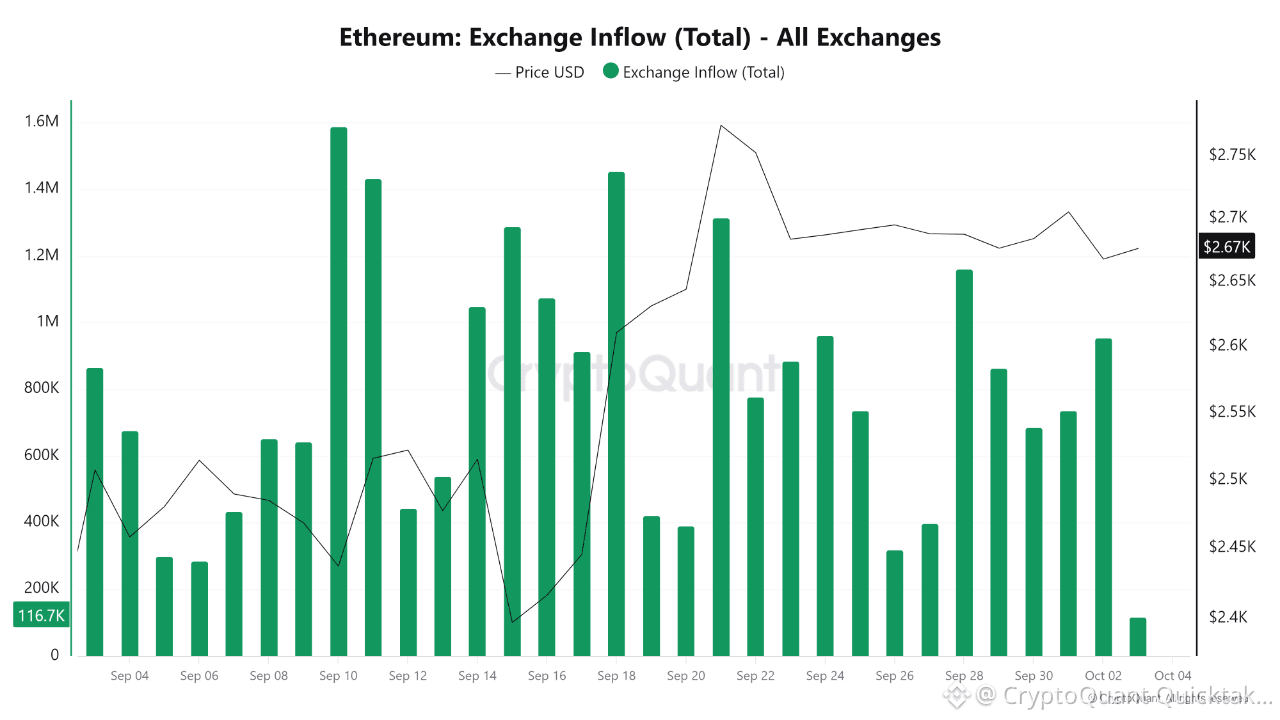
Ethereum's exchange inflow and outflow have moved in near lockstep for most of the past month, both spiking on the same days, both easing on the same days. The exception is the most recent reading, where outflow finally pulled ahead of inflow, 129.7K versus 116.7K.
Looking at both charts side by side, the pattern through September is strikingly synchronized. The largest spikes, September 10 near 1.58M in and 1.55M out, September 18 around 1.45M in and 1.3M out, September 22 near 1.3M on both sides, September 28 around 1.15M on both sides, all land on identical days with nearly matching magnitude. That kind of twin movement usually points to high churn, large volumes cycling through exchanges, rather than one directional trend building across the month.
What changes at the very end is worth flagging. The latest print shows outflow at 129.7K against inflow at 116.7K, a net negative flow day, coins leaving exchanges rather than the roughly balanced churn that dominated the prior four weeks. One data point doesn't establish a new trend, but it's the first clear divergence in an otherwise matched month.
Price moved from around $2.40K in mid September up to $2.67K by early October, with the sharpest jump, roughly $2.45K to $2.70K between September 19 and 21, landing right after the September 18 inflow and outflow spike. Large two sided flow preceding a price breakout is worth noting, though it doesn't establish causation.
My honest read: a month of matched inflow and outflow mostly describes active trading and repositioning, not sustained accumulation or distribution. The final day's shift toward net outflow is the one genuinely new signal, worth watching for confirmation rather than treating as settled.
What I'm watching: whether outflow continues leading inflow over the next several sessions, which would mark an actual shift from this month's balanced pattern, or whether this reverts back to matched twin spikes.
Written by R3N