



Western Digital stock is sharply lower on Friday, erasing Thursday’s gain as an intraday slide breaks through several layers of daily support. Trading at $419.84 as of 09:43 ET, the stock was down 9.24% versus Thursday’s close of $462.56.
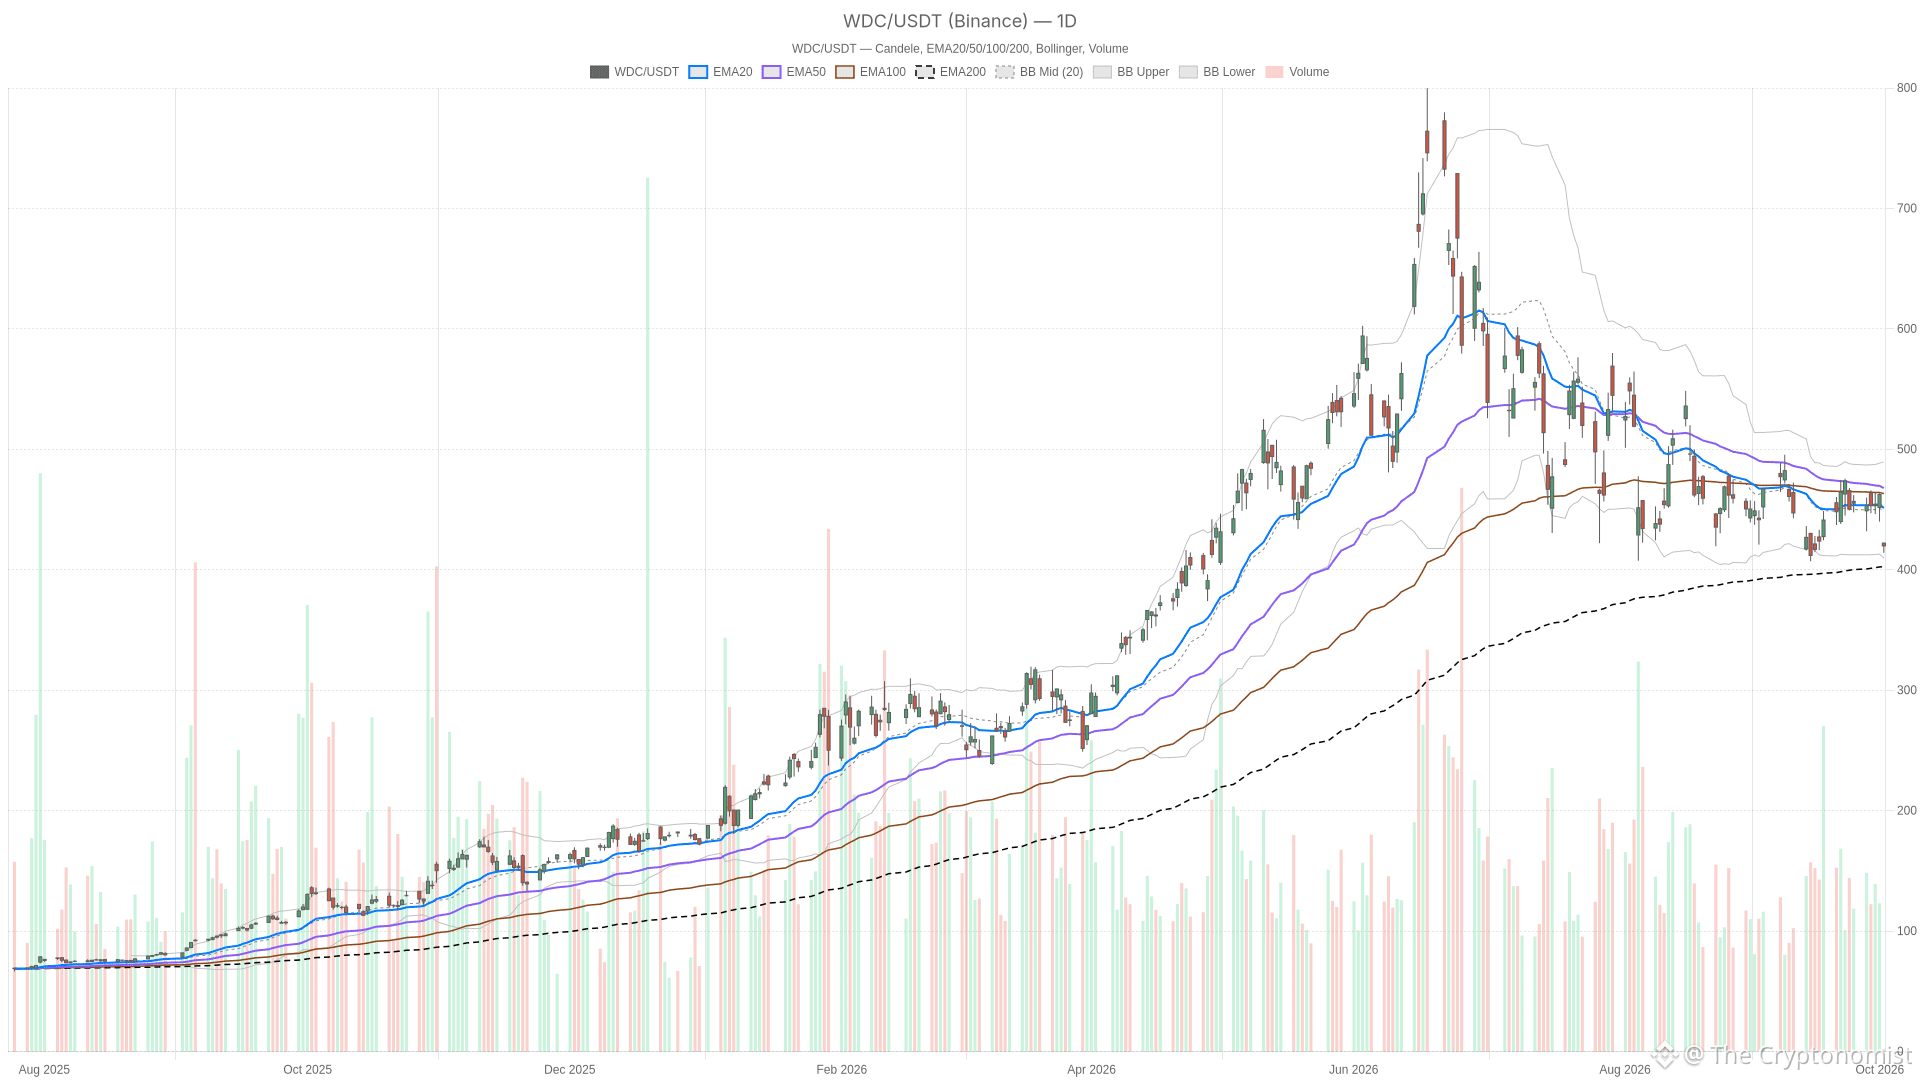 WDC — daily chart with candlesticks, EMA20/EMA50 and volume.
Key takeaways
Western Digital stock was trading at $419.84 as of 09:43 ET, down 9.24% from Thursday’s close of $462.56.
Price has broken below the daily S1 support at $447.22 and the daily pivot point at $455.39.
The hourly chart shows a fully bearish EMA stack, with price below the 20-hour, 50-hour, and 200-hour averages.
Daily RSI14 at 40.14 remains above oversold territory, while the hourly RSI14 at 29.78 approaches oversold conditions.
The bearish path points toward the daily lower Bollinger band at $409.72 and the 200-session EMA at $391.04.
The reversal follows a constructive run of coverage earlier in the week. On Thursday, Western Digital closed at $462.56, a gain of 1.78% from the prior session, according to a report from Yahoo Finance UK. Sentiment had also been supported by Seeking Alpha’s Steven Cress, who highlighted an improving valuation grade and a top-tier quant rating tied to the company’s AI storage demand, while a separate Seeking Alpha piece detailed how WD Red Pro HDDs are being positioned to support AI-powered NAS systems. A Yahoo Finance report noted that Zacks.com users had been watching the stock closely, and another Yahoo Finance piece framed Western Digital alongside other AI infrastructure names as a potential beneficiary of rising bond yields pulling capital toward cash-generative, real-asset businesses. None of this coverage, however, addresses Friday’s sharp reversal directly.
Western Digital Stock: Daily Structure Weakens
Trend Averages Signal Short-Term Weakness
On the daily chart, Western Digital stock sits below both its 20-session EMA at $451.23 and its 50-session EMA at $467.75. At the same time, it remains above the 200-session EMA at $391.04. That is a mixed position: short- and medium-term trends have turned down. Yet the broader daily structure has not broken below the long-run average.
Momentum Indicators Point to Softening Conditions
The daily RSI14 reads 40.14, below the neutral 50 line but not yet in oversold territory. Momentum is soft rather than exhausted. The daily MACD line stands at -5.81, above its signal at -6.71, with a positive histogram of 0.9. Both values remain below zero, so the broader daily trend is still negative. Notably, the line sitting above its signal suggests the pace of selling has eased, at least for the moment.
Support Levels Give Way
Price is trading between the daily Bollinger mid-band at $449.67 and the lower band at $409.72. It sits closer to the lower band than the mid-band. The daily ATR14 reads 27.73, pointing to a wide average range and elevated volatility. Friday’s decline has broken decisively below the daily S1 support at $447.22. Price now sits well under the pivot point itself at $455.39. That is a meaningful technical breach, not a minor dip.
Hourly Momentum Confirms the Bearish Tilt
The hourly timeframe leaves little ambiguity. Price sits below the 20-hour EMA at $451.12. That average sits just below the 50-hour EMA at $451.72, which in turn sits below the 200-hour EMA at $455.88. This is a fully bearish stack, with price under every average in descending order.
The hourly RSI14 has fallen to 29.78, approaching oversold conditions. The hourly MACD line is at -2.27, below its signal at -0.36, with a negative histogram of -1.91. Downside momentum is intact and, unlike the daily reading, shows no early sign of easing. Price has also dropped below the hourly lower Bollinger band at $434.27. Meanwhile, the hourly pivot point at $460.84 and S1 support at $458.12 both sit well above current price.
This is where the daily and hourly pictures diverge. The daily setup, despite the break through S1, still carries a neutral undertone. Price remains above its 200-session EMA. The hourly chart, in contrast, is unambiguously bearish. Full EMA alignment to the downside is paired with momentum accelerating rather than stabilizing. In practice, the hourly weakness confirms and intensifies the daily deterioration.
15-Minute Chart: Execution Context
On the 15-minute chart, used here only for timing, RSI14 stands at 24.09, firmly in oversold territory. The MACD line sits at -1.26, below its signal at 0.11, with a negative histogram of -1.37. Price also trades beneath the 15-minute lower Bollinger band at $433.5 and well under the 15-minute S1 support at $460.66. Therefore, the short-term oversold reading raises the possibility of a bounce or consolidation. However, it does not by itself reverse the dominant hourly and daily pressure.
Bullish and Bearish Paths for Western Digital Stock
A bullish case for Western Digital stock would need price to first reclaim the daily S1 support at $447.22, then the daily pivot point at $455.39. Clearing the daily 20-session EMA at $451.23 would further ease the immediate pressure. On the hourly chart, a recovery above the pivot point at $460.84 would be needed. That, paired with RSI14 moving back above 50, would confirm buyers have regained control. Until those levels are reclaimed, any bounce remains vulnerable to renewed selling.
The bearish case is currently the path of least resistance. A continuation lower would likely test the daily lower Bollinger band at $409.72. The 200-session EMA at $391.04 would be the next structural reference beyond that. On the hourly chart, a persistently negative histogram would keep sellers in control. Price remaining under the lower Bollinger band at $434.27 would reinforce that control. Only a reclaim of the levels outlined above would invalidate this bearish continuation.
Overall, as of 09:43 ET, Western Digital stock was trading at $419.84, down 9.24% versus Thursday’s close of $462.56. Price sits below every meaningful daily and hourly support level. This includes the daily pivot at $455.39, S1 support at $447.22, and the hourly pivot point at $460.84. The daily ATR14 at 27.73 reflects a genuinely wide trading range. What remains uncertain is whether this is a sharp, short-term overshoot. The oversold readings on the 15-minute and hourly charts support that interpretation. Alternatively, it could be the start of a deeper correction that eventually tests the 200-session EMA. For now, the charts do not settle that question.
FAQ
What is the current price of Western Digital stock?
Western Digital stock was trading at $419.84 as of 09:43 ET on Friday, down 9.24% versus Thursday’s close of $462.56.
What are the key support levels to watch?
The daily S1 support at $447.22 and the daily pivot point at $455.39 have already been broken. The next downside references are the daily lower Bollinger band at $409.72 and the 200-session EMA at $391.04.
Is Western Digital stock oversold?
It depends on the timeframe. The daily RSI14 at 40.14 is not yet oversold. However, the hourly RSI14 at 29.78 is approaching oversold conditions, and the 15-minute RSI14 at 24.09 is firmly oversold.
What would signal a bullish reversal?
A bullish reversal would require price to reclaim the daily S1 support at $447.22 and the daily pivot at $455.39. On the hourly chart, a recovery above the pivot point at $460.84, paired with RSI14 moving back above 50, would be needed to confirm buyers have regained control.
Disclaimer: This article is for informational purposes only and does not constitute financial advice, an investment recommendation, or a solicitation to buy or sell any financial instrument or cryptocurrency. The analysis provided is not indicative of future results. Investing in crypto assets and financial markets carries a high risk of capital loss. Always do your own research (DYOR) and consult a qualified financial advisor before making any decision.
Article produced with the assistance of artificial intelligence and reviewed by the editorial team.