


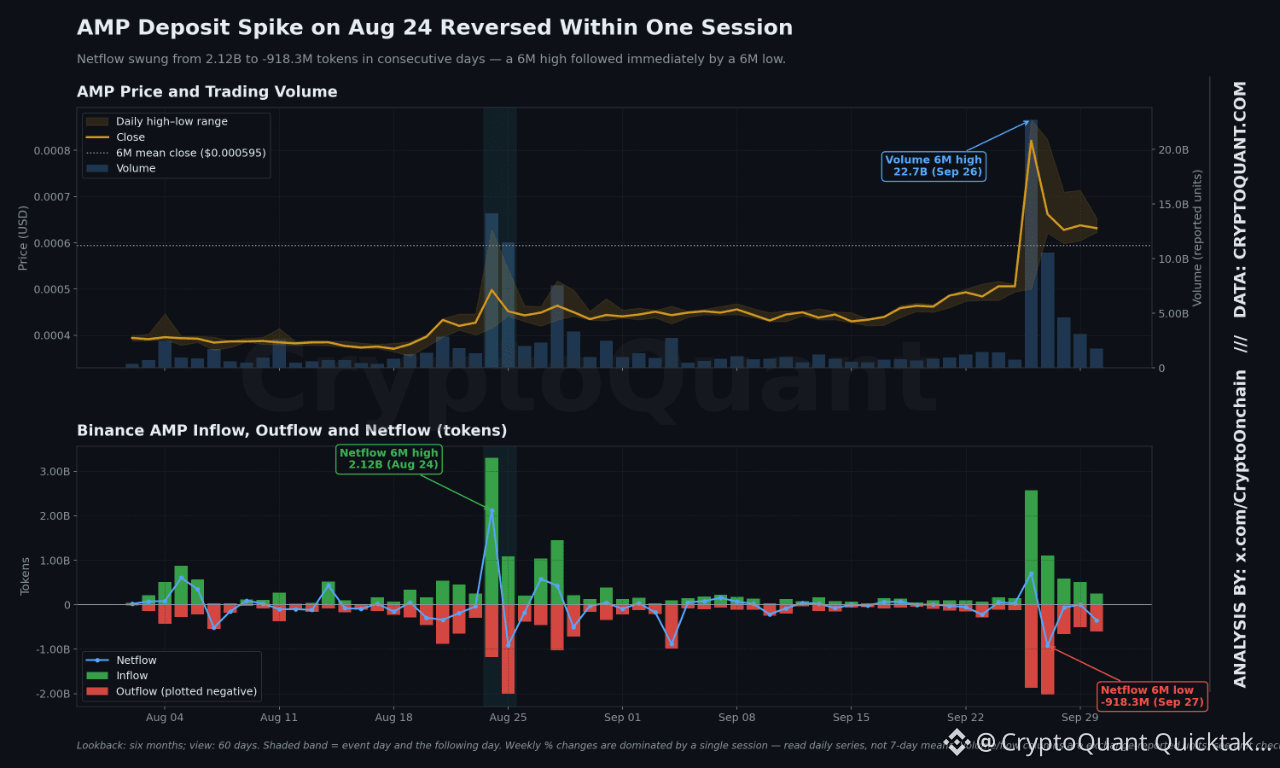
AMP’s 7-day averages look explosive (volume +572% w/w, transactions +413%, active addresses +120%), but the daily data shows this is a single-day event, not a trend. On Sep 26, volume hit $22.7B and transaction count reached 11,216 — both 6-month highs, roughly 15–30x the prior baseline. Active addresses rose to 790, below the 6-month peak of 940.
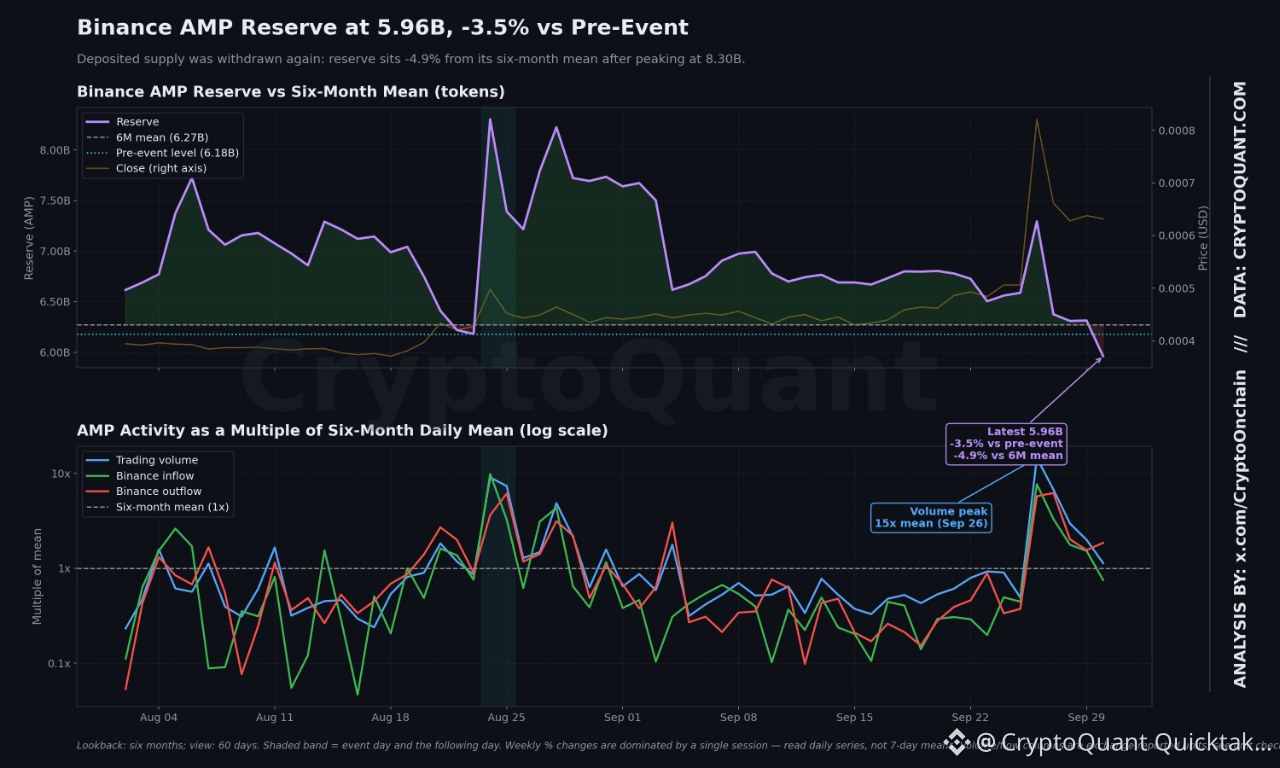
The exchange flow pattern is the real story. On Sep 26, 2.58B AMP flowed into Binance (netflow +706M) and reserve jumped from 6.59B to 7.29B. The very next day, 2.02B flowed out — the largest daily outflow in six months — pushing netflow to -918M, a 6-month low. Reserve dropped to 6.37B and has drifted to ~6.31B since, about 4% below the pre-event level and close to the 6-month mean of 6.27B. In short: the supply that came in to be sold was fully absorbed, and more left than arrived.
Deposit composition points to retail participation. Average inflow per transaction (4.08M) is roughly half the 6-month mean (8.1M), and top-10 inflow (5.56M) is 40% below its 6-month average — many small deposits rather than whale distribution. Reserve in USD rose 29% while reserve in tokens fell 3.7%, confirming the move is price-driven, not accumulation on exchange.
Price closed +34% w/w and +46% vs. three months ago, with velocity at 36.7, near its 6-month high (36.9) and above the mean (34.3) — the token is turning over faster than usual.
The caveat: momentum is fading quickly. Daily transactions fell 11,216 → 6,460 → 3,013 → 1,664, converging back toward the 6-month mean of ~1,050. Key signals to watch: whether transaction count holds above the 6-month average, and whether Binance reserve continues to decline. A reserve break below 6.2B with steady outflows would suggest holders are withdrawing after the event; a return to the pre-spike reserve would indicate the rally is being sold into.
Written by CryptoOnchain