



As of October 1, 2026, NEAR trades around $5.46 against USDT, making this Near crypto asset a standout mover while the broader market cools. Total crypto market cap slipped 1.83% over 24 hours to roughly $2.89 trillion, yet NEAR pushes higher on its own momentum.
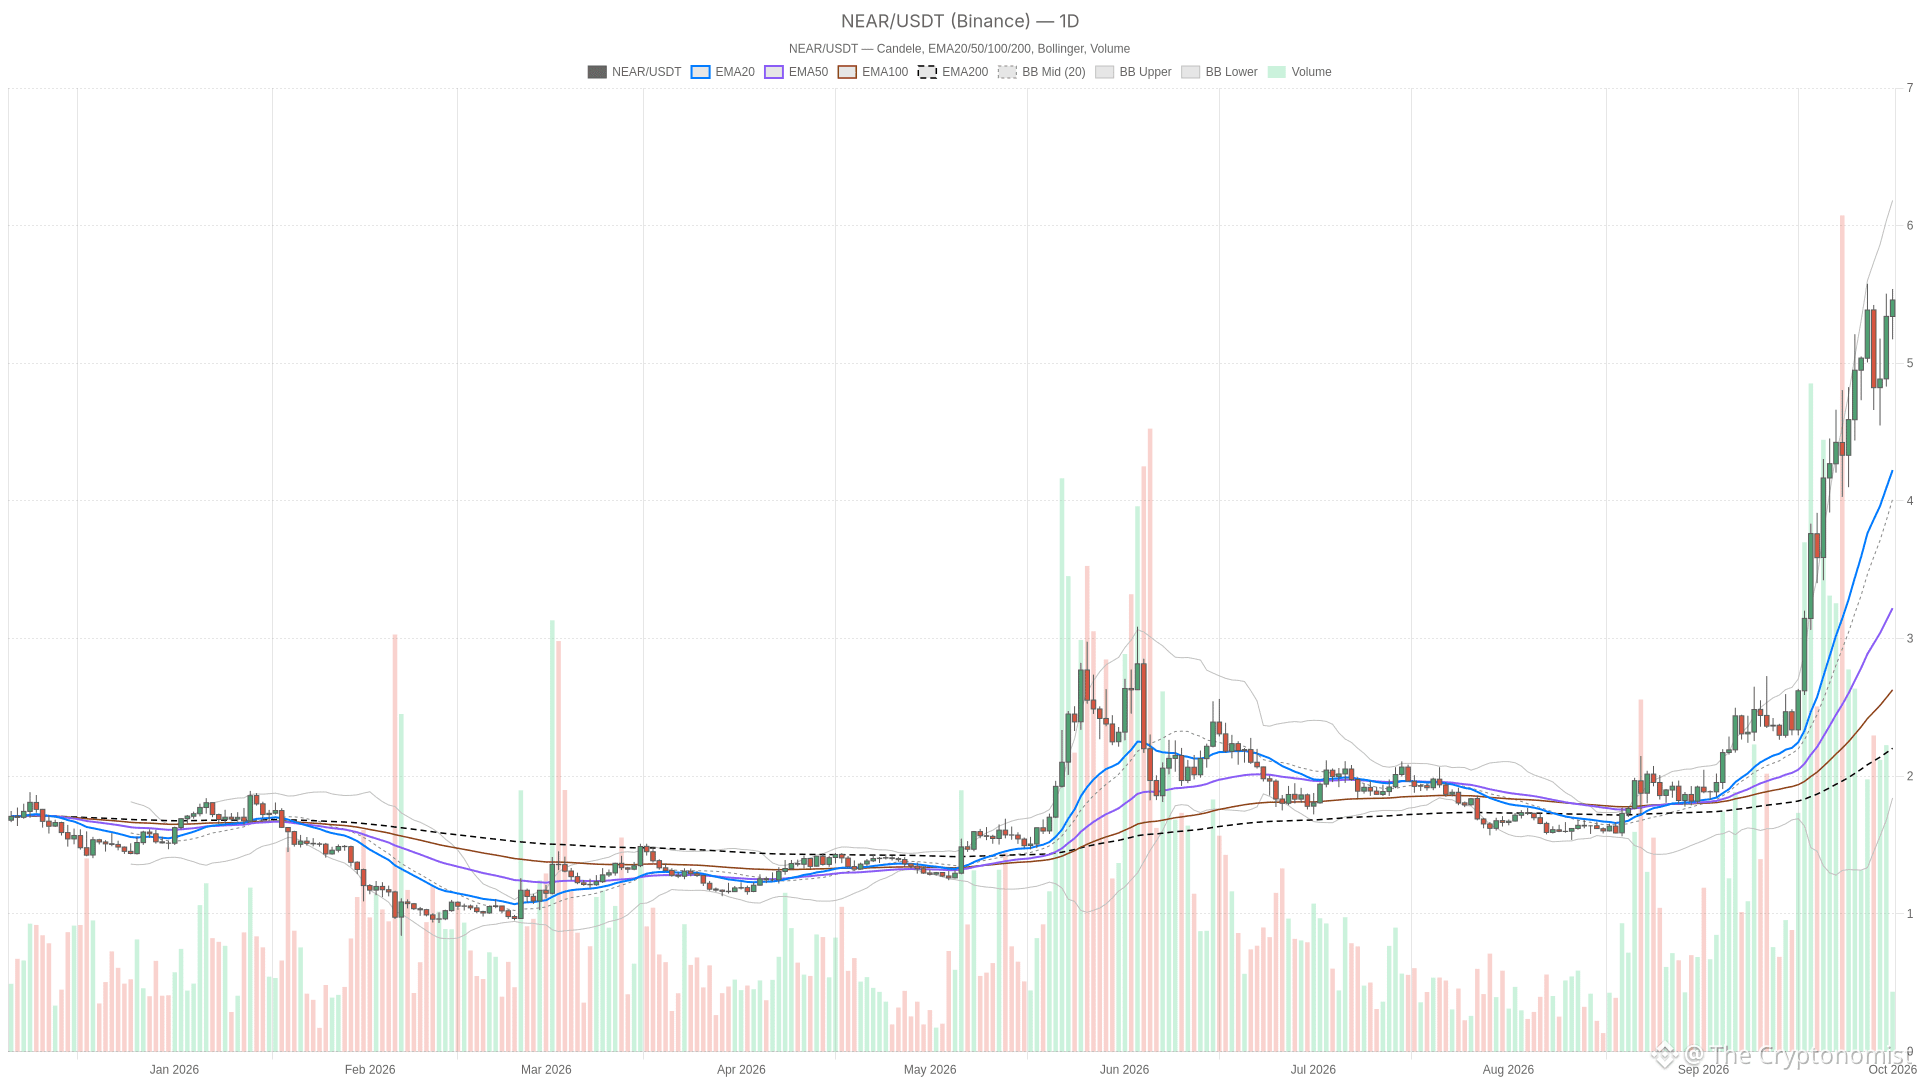 NEAR/USDT — daily chart with candlesticks, EMA20/EMA50 and volume.
Key takeaways
NEAR trades at $5.46 with the daily RSI at 76.9, firmly in overbought territory.
The EMA20, EMA50, and EMA200 remain stacked bullishly, confirming a sustained uptrend.
Total crypto market capitalization fell 1.83% to roughly $2.89 trillion over 24 hours.
The Fear & Greed Index stands at 74 (“Greed”), signaling elevated risk appetite.
NEAR ecosystem protocols posted fee growth ranging from 40% to over 749% in the past 30 days.
Daily Chart: Strong Trend, Stretched Momentum
On the daily timeframe, NEAR’s regime is unambiguously bullish. Price at $5.46 sits well above the EMA20 at 4.2244, EMA50 at 3.2216, and EMA200 at 2.2036. The clean separation between those three averages reflects a sustained, well-respected uptrend rather than a choppy range.
The daily RSI at 76.9, however, is where the caution flag goes up. That is firmly in overbought territory, and historically readings this hot do not resolve cleanly. They either trigger a sharp mean-reversion flush or a sideways grind that lets momentum cool off without price giving back much ground. The daily MACD still supports the bulls: the MACD line at 0.78016 sits above the signal line at 0.69605 with a positive histogram at 0.084106. Upside momentum is technically still expanding, even as the RSI suggests exhaustion.
Meanwhile, Bollinger Bands on the daily add useful context. With the mid-band at 4.0133 and the upper band at 6.1835, price at $5.46 runs in the upper half of the envelope but has not yet tagged the top. The daily ATR of 0.62564 confirms that swings exceeding half a dollar per day are now normal. Stop placement and position sizing need to respect that range.
Pivot levels frame the next decision zone: the daily pivot point sits at 5.3913, with resistance R1 at 5.6087 and support S1 at 5.2427. Price hovers just above the pivot, keeping the bias constructive as long as that level holds as a floor.
1H and 15m: Momentum Is Cooling, Not Breaking
The hourly chart confirms the bullish macro bias but with noticeably less thrust. EMA20 at 5.3144, EMA50 at 5.1798, and EMA200 at 4.8633 remain stacked bullishly. The RSI at 63.21 is healthy without being overheated — a meaningful contrast to the daily reading of 76.9. That gap is the central tension in this setup: the bigger trend is overbought, yet shorter-term momentum has already cooled.
The hourly MACD backs up that cooling-off story. The MACD line at 0.088393 and signal line at 0.085322 are nearly touching, and the histogram has shrunk to just 0.003071. Momentum is decelerating on this timeframe even though price has not broken down. Bollinger Bands on the 1H, with the mid-band at 5.3457 and upper at 5.4775, show price pressing against the top — short-term buyers remain active but have limited room without a band expansion.
On the 15-minute chart, used strictly for execution timing, the picture stays constructive. EMA20 at 5.4121 sits above EMA50 at 5.3551, which sits above EMA200 at 5.1788, with RSI at 61.86 and a small positive MACD histogram at 0.0082944. The 15m pivot at 5.4667, with resistance at 5.4823 and support at 5.4473, defines a tight range — useful for entries but not for building a directional thesis.
What’s Driving the Tape Beneath the Chart
Moreover, activity data around the NEAR ecosystem provides context for the capital rotation into this asset. NEAR Intents, a bridge protocol, posted a 40.05% increase in fees over 30 days despite daily and weekly pullbacks. THORSwap, a DEX aggregator touching NEAR flows, saw fees jump 477.43% over 30 days and 112.74% over 7 days. DeltaTrade’s fee growth reached 749.45% over the month. The 30-day trend across these venues points to genuine usage growth rather than pure speculation.
Bullish Scenario
If NEAR holds above the daily pivot at 5.3913 and defends S1 support at 5.2427, the uptrend stays intact and the overbought RSI becomes a pause, not a reversal. A move through daily R1 at 5.6087 would open the door toward the upper Bollinger Band near 6.1835. Continued fee growth across NEAR Intents and the DEX ecosystem would give that move fundamental backing. Confirmation would come from the hourly MACD histogram turning higher and RSI reclaiming the 70s without the daily chart breaking its EMA20.
Bearish Scenario
In contrast, the bearish case starts with that daily RSI at 76.9. If NEAR fails to hold the 5.39 pivot zone and slips through S1 at 5.2427, the stretched momentum could unwind quickly given an ATR of 0.62564 per day. A break below the hourly EMA50 at 5.1798 would signal short-term buyers stepping back. A decisive move under the daily EMA20 at 4.2244 would invalidate the bullish structure entirely. With broader market cap already down 1.83%, a Bitcoin slowdown could easily trigger that unwind.
Positioning and Risk
Near crypto now sits at a genuine fork: the daily trend is as bullish as it has been in months, yet the daily RSI is overbought enough that chasing strength without a plan is a mistake. The hourly and 15-minute timeframes behave normally, but that can change fast. With market-wide sentiment at Greed (74) and total market cap already pulling back, conditions favor sharp, two-sided moves. Anyone sizing positions should treat the ATR-driven ranges — roughly $0.62 daily and $0.12 hourly — as the realistic cost of being wrong.
FAQ
What does the overbought RSI reading mean for NEAR?
The daily RSI at 76.9 signals NEAR is in overbought territory. Historically, such readings lead either to a sharp mean-reversion flush or a sideways consolidation that cools momentum without significant price loss. The hourly RSI at 63.21 suggests short-term momentum has already begun cooling, creating a tension between timeframes.
What are NEAR’s key support and resistance levels?
The daily pivot sits at 5.3913, with support S1 at 5.2427 and resistance R1 at 5.6087. A break above R1 opens the path toward the upper Bollinger Band near 6.1835, while losing S1 could trigger a swift unwind toward the hourly EMA50 at 5.1798 and potentially the daily EMA20 at 4.2244.
Is NEAR’s rally backed by actual usage growth?
Yes. NEAR Intents posted a 40.05% increase in fees over 30 days, THORSwap fees jumped 477.43%, and DeltaTrade’s fee growth reached 749.45% over the same period. These trends indicate genuine ecosystem activity rather than pure speculation, offering a more durable foundation for the trend.
What could trigger a bearish reversal for NEAR?
A failure to hold the 5.39 pivot zone followed by a break below S1 at 5.2427 could unwind the overbought daily momentum quickly given the ATR of 0.62564. A move below the hourly EMA50 at 5.1798 would confirm buyers are stepping back, and losing the daily EMA20 at 4.2244 would invalidate the bullish structure entirely.
Disclaimer: This article is for informational purposes only and does not constitute financial advice, an investment recommendation, or a solicitation to buy or sell any financial instrument or cryptocurrency. The analysis provided is not indicative of future results. Investing in crypto assets and financial markets carries a high risk of capital loss. Always do your own research (DYOR) and consult a qualified financial advisor before making any decision.
Article produced with the assistance of artificial intelligence and reviewed by the editorial team.