



ImmunityBio stock surged 10.25% on Wednesday, trading at $9.735 as of 14:04 ET. Volume reached 1,030,971 shares. The rally pushed shares to recent intraday highs without an accompanying news catalyst. The daily chart confirms the bullish backdrop.
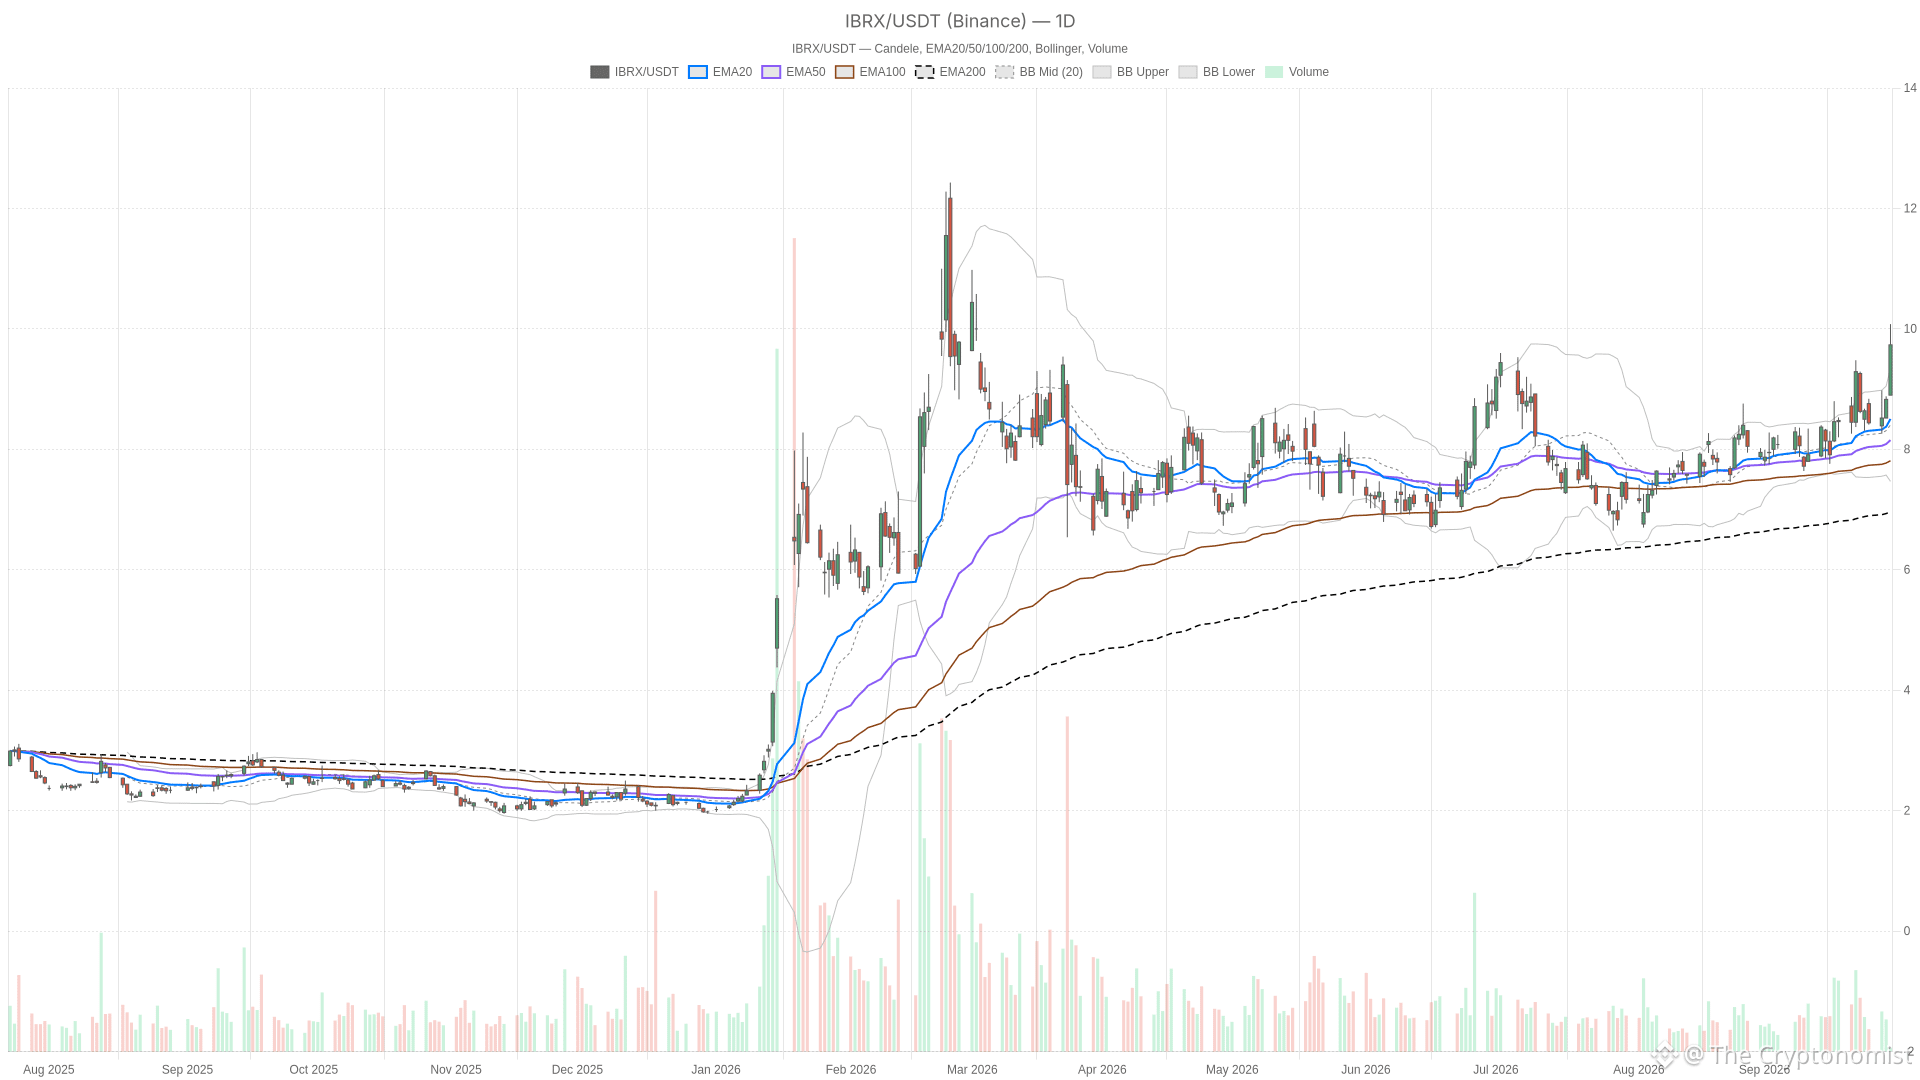 IBRX — daily chart with candlesticks, EMA20/EMA50 and volume.
Key takeaways
ImmunityBio stock jumped 10.25% to $9.735, reaching the highest intraday levels in recent sessions.
The daily EMA stack is fully bullish, with price above the 20-, 50-, and 200-session EMAs.
Daily RSI at 67.02 and positive MACD confirm momentum, though hourly RSI at 70.29 signals overbought conditions.
The 15-minute chart shows a potential short-term pause with a negative MACD histogram of -0.04.
Daily resistance sits at $10.24, with the $9.57–$9.74 pivot zone acting as key support.
ImmunityBio Stock Technical Setup: Daily Trend Turns Decisively Bullish
The daily chart shows a fully bullish EMA alignment with price above all three key averages and momentum indicators confirming the trend.
On the daily chart, price sits well above its 20-session EMA at $8.51. That average itself sits above the 50-session EMA at $8.15 and the 200-session EMA at $6.63. This creates a clean bullish stack: price above EMA20, above EMA50, above EMA200. Momentum backs it up. The 14-period RSI reads 67.02, elevated but not yet at extreme levels. The MACD line at 0.30 sits above its signal at 0.21, leaving a positive histogram of 0.09.
The Bollinger setup adds another layer. Price near $9.73 is already above the daily upper band at $9.34. The midline stands at $8.40. That kind of extension beyond the band usually signals strong directional pressure. However, it can also precede a pause as the band widens to catch up with price. Daily ATR stands at 0.57, a useful gauge of how wide normal swings have become.
Pivot levels frame the next test. The daily pivot point sits at $9.57, already cleared. Resistance stands at $10.24 and support at $9.06. Therefore, the path of least resistance on the daily timeframe points higher, provided buyers keep defending the pivot zone.
Multi-Timeframe View: Hourly Confirms, 15-Minute Flags a Pause
The hourly chart confirms the daily bullish structure, while the 15-minute chart signals a potential short-term pause. Traders should watch the divergence between higher and lower timeframe momentum.
Hourly Chart Aligns With Daily Bullish Setup
The hourly chart mirrors the daily bias. Price sits above the 20-, 50-, and 200-hour EMAs at $9.10, $8.80, and $8.28 respectively, keeping the stack aligned bullish. RSI on the hourly reads 70.29, however, which is firmly in overbought territory. This suggests the move is getting stretched on a short-term basis. MACD on the hour remains positive, with a histogram of 0.12. Momentum has not turned yet.
Meanwhile, the hourly pivot at $9.74 sits almost exactly at the current price. Resistance stands at $9.79 and support at $9.69. That tightness points to a market pausing to digest gains rather than one that has already exhausted them.
15-Minute Momentum Shows Signs of Stalling
On the 15-minute chart, the EMA stack is still bullish. Price holds above the 20-, 50-, and 200-period EMAs at $9.62, $9.26, and $8.76. However, the MACD histogram has slipped to -0.04, a negative reading that contrasts with the positive histograms on both higher timeframes. This is a short-term conflict worth noting. Intraday momentum appears to be stalling even as the broader daily and hourly trends stay intact. RSI on the 15-minute at 59.79 is consistent with a cooling-off phase rather than a reversal.
In short, the three timeframes are not perfectly aligned. Daily and hourly charts back the bullish case. The 15-minute chart hints at a pause that traders should watch before assuming the next leg higher is imminent.
Context From Recent News
No fresh company announcement accompanied today’s move. However, recent developments have shaped the broader bullish context surrounding ImmunityBio stock.
Last week, ImmunityBio shares climbed after a meeting between founder Dr. Patrick Soon-Shiong and Turkish President Recep Tayyip Erdogan. Shares jumped 9.94% on Tuesday to finish at $9.29, according to a Yahoo Finance report. That event helped set the stage for the broader advance. It does not explain today’s separate move, however.
Separately, a Yahoo Finance report on the GA-Courtenay Special Situations Fund highlighted what it called a $5.8 billion cancer market opportunity favoring ImmunityBio. Notably, the same report noted that the fund itself posted a 13.8% decline in July. That brought its year-to-date performance to -10.0%. It is a reminder that conviction in the name has come with volatility for at least one specialized fund.
Bullish and Bearish Scenarios for ImmunityBio Stock
A bullish scenario targets a breakout above $10.24 resistance. The bearish case centers on overbought conditions triggering a pullback toward the daily EMA20.
Bullish Case
The bullish case for ImmunityBio stock rests on the daily EMA alignment holding. Price would need to clear the $10.24 resistance implied by the daily pivot calculation. A sustained move through that level, supported by the hourly chart staying above its $9.74 pivot, would argue for continuation toward fresh highs. For that scenario to gain traction, the 15-minute MACD would need to turn positive again. That would confirm the short-term pause was just that—a pause.
Bearish Risks
The bearish risk starts with the overbought hourly RSI at 70.29. If price loses the hourly pivot at $9.74 and support at $9.69, a pullback becomes more likely. The retreat could extend toward the daily EMA20 near $8.51 or even the daily pivot at $9.57. A slip back below the previous close of $8.83 would be a more serious signal. It would undermine the idea that this advance can hold without a fresh catalyst.
Positioning and Outlook
ImmunityBio stock enters the remainder of Wednesday’s session firmly in bullish territory on the daily and hourly charts. Near-term caution is warranted, however, given the 15-minute signals.
Overall, ImmunityBio stock heads into the remainder of Wednesday’s session firmly positioned in bullish territory on the daily and hourly charts. The 15-minute picture, however, argues for some near-term caution. Daily ATR of 0.57 and hourly ATR of 0.23 both point to elevated volatility. Swings in either direction could be sharp. Positioning around the $9.57 to $9.74 pivot zone looks like the key battleground for the next move. Given the overbought readings on both the daily and hourly RSI, some consolidation would not be surprising before any fresh push higher. The uncertainty around that near-term pause is worth respecting.
FAQ
What is driving ImmunityBio stock higher today?
No specific news catalyst is attached to today’s session. The rally appears driven by positioning and momentum, supported by a bullish daily EMA stack with price above the 20-, 50-, and 200-session EMAs.
Is ImmunityBio stock overbought?
The daily RSI at 67.02 is elevated but not yet at extreme levels. However, the hourly RSI at 70.29 signals overbought conditions on a short-term basis, suggesting the intraday move may be stretched.
What are the key resistance levels for ImmunityBio stock?
The daily pivot resistance sits at $10.24. On the hourly chart, resistance stands at $9.79, just above the hourly pivot at $9.74.
What recent news has affected ImmunityBio stock?
Last week, shares rose after founder Dr. Patrick Soon-Shiong met with Turkish President Erdogan. Separately, a fund report highlighted a $5.8 billion cancer market opportunity favoring the company.
Disclaimer: This article is for informational purposes only and does not constitute financial advice, an investment recommendation, or a solicitation to buy or sell any financial instrument or cryptocurrency. The analysis provided is not indicative of future results. Investing in crypto assets and financial markets carries a high risk of capital loss. Always do your own research (DYOR) and consult a qualified financial advisor before making any decision.
Article produced with the assistance of artificial intelligence and reviewed by the editorial team.