

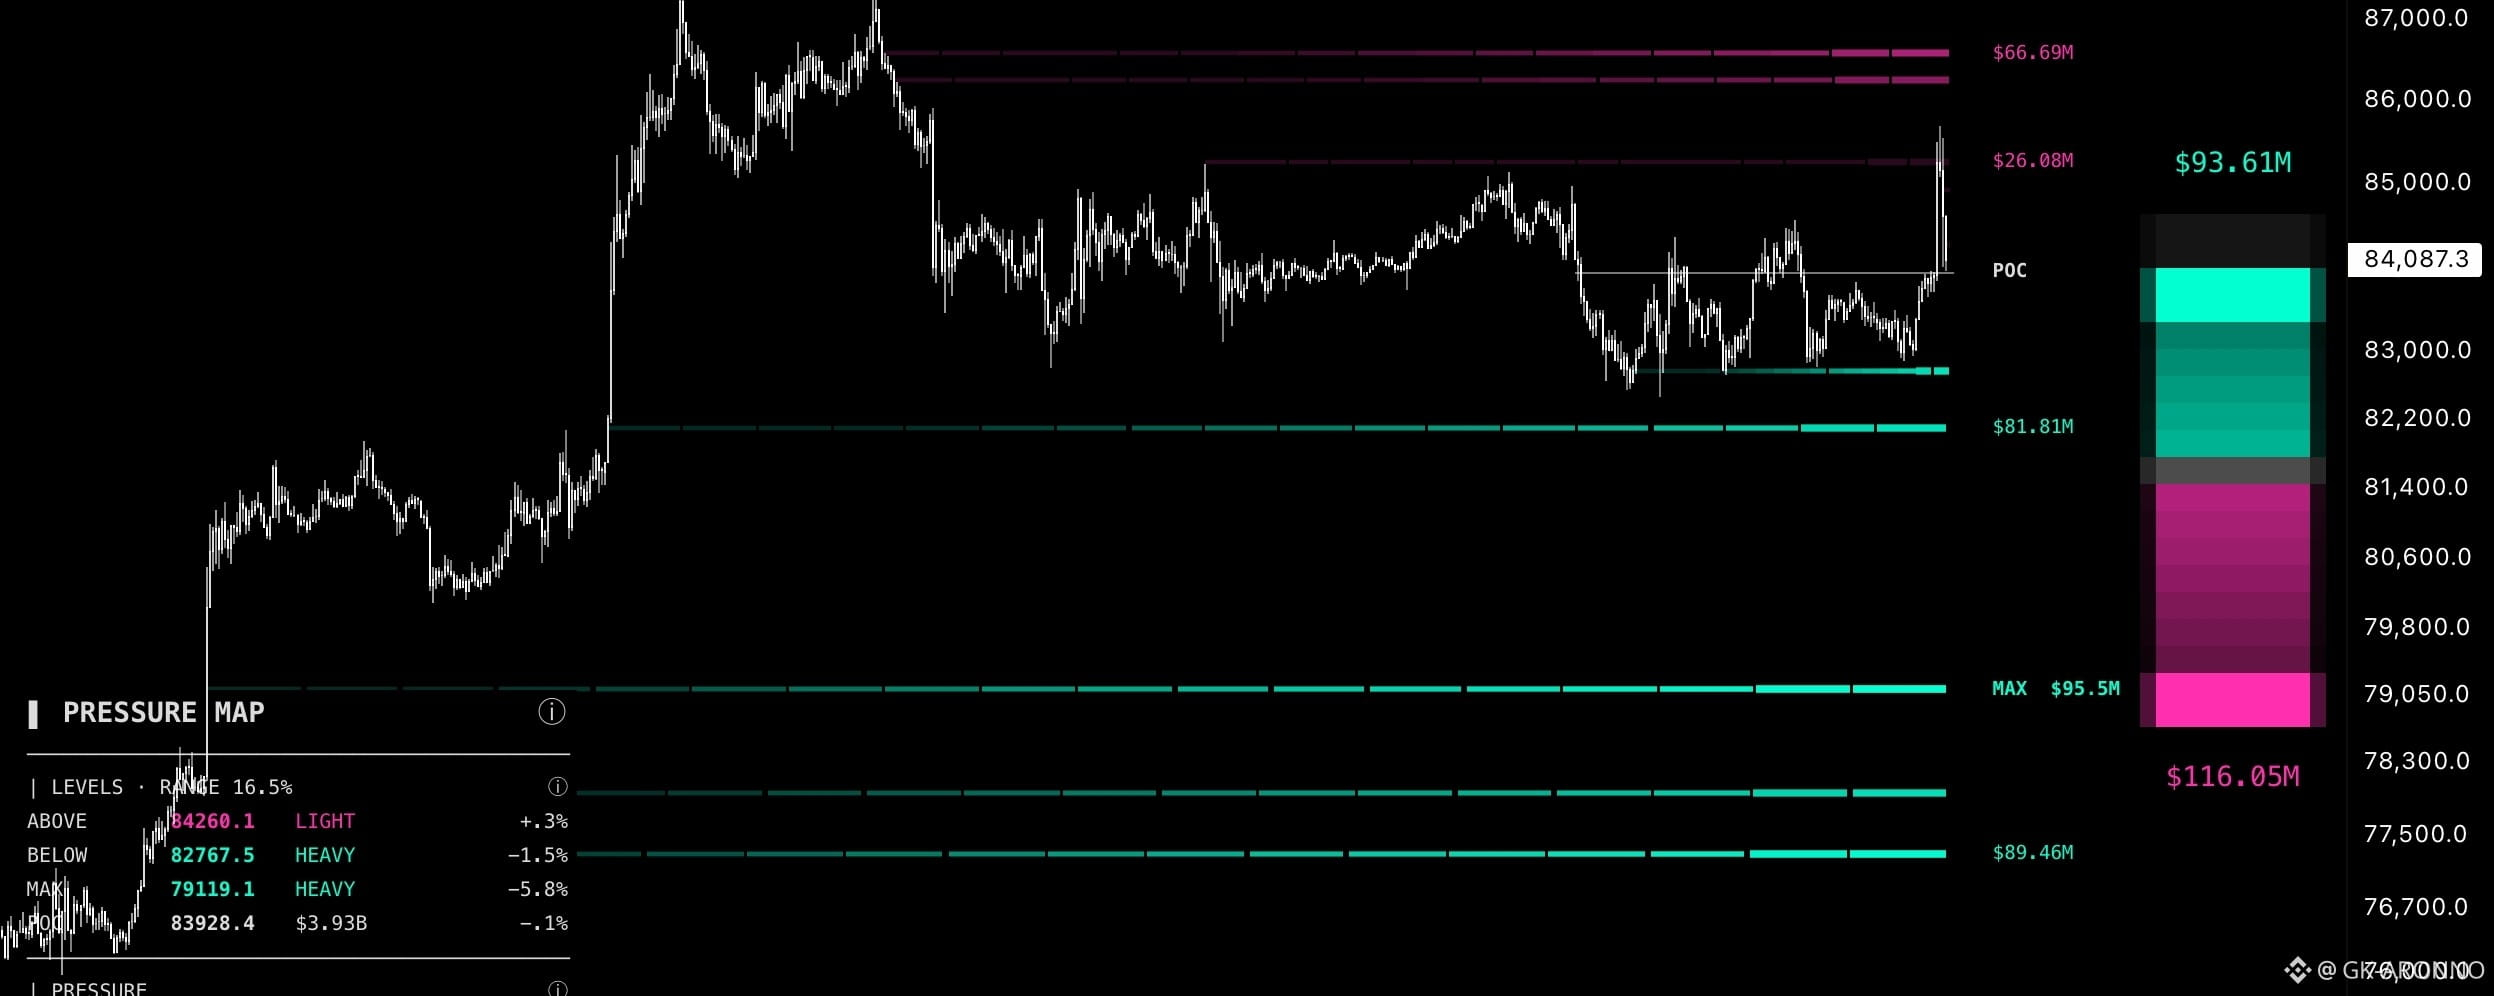


Order Flow Pressure Map reads TradingView's footprint: the buying and selling that actually executed at each price. Where one side clearly won and price moved away, it draws a wall, and the wall stays until a candle closes back through it. This is BTC since 16 Sep, the base of the last leg.
▌ THE REJECTION
Today's push ran straight into the nearest selling wall, 84,927. The candle wicked to about 85,600 and closed back under it. A wick is a test; only a close through the far side removes a wall, so it is still on the chart.
▌ THE FLOW IN THREE NUMBERS
- $1.79B of active buying pressure against $219.4M of selling. 89 / 11.
- The busiest price since 16 Sep: 83,931, the POC, with $3.93B traded, just under price.
- The strongest wall still standing: 79,117, $95.5M of net buying, 6.2% below.
▌ READING IT
1. Above price, selling pressure is thin, and it answered: 84,927, then about 86,500 ($66.9M) just under the top.
2. Below price, buyers built this leg in steps, and most of them have not been revisited: 82,769 first (HEAVY, 1.8% away), about 82,100 ($84.3M), 79,117, then near 77,900 and 77,300 ($88.1M).
3. The rail on the right shows the candle forming now: $53.6M of selling against $46.8M of buying.
▌ WHAT TO WATCH
Two first touches. A close above 84,927 clears the selling wall. A return to 82,769 tests the nearest buying wall. Either way, the rail shows which side turns up.
Numbers as shown on the chart at the time of posting.
Not advice.
21 minutes ago
Note
▌ UPDATE · THE REJECTION, UNPACKED
The push to 85,600 had help. HEATMAP showed shorts' liquidity right under the 84,927 wall, and the Liquidation Pain Map printed the liquidations as price ran into it. Forced buying met chosen selling, and the wall held. The $1.79B of buying pressure sits below price, across the whole leg. Next: 82,769, the nearest buying wall.
