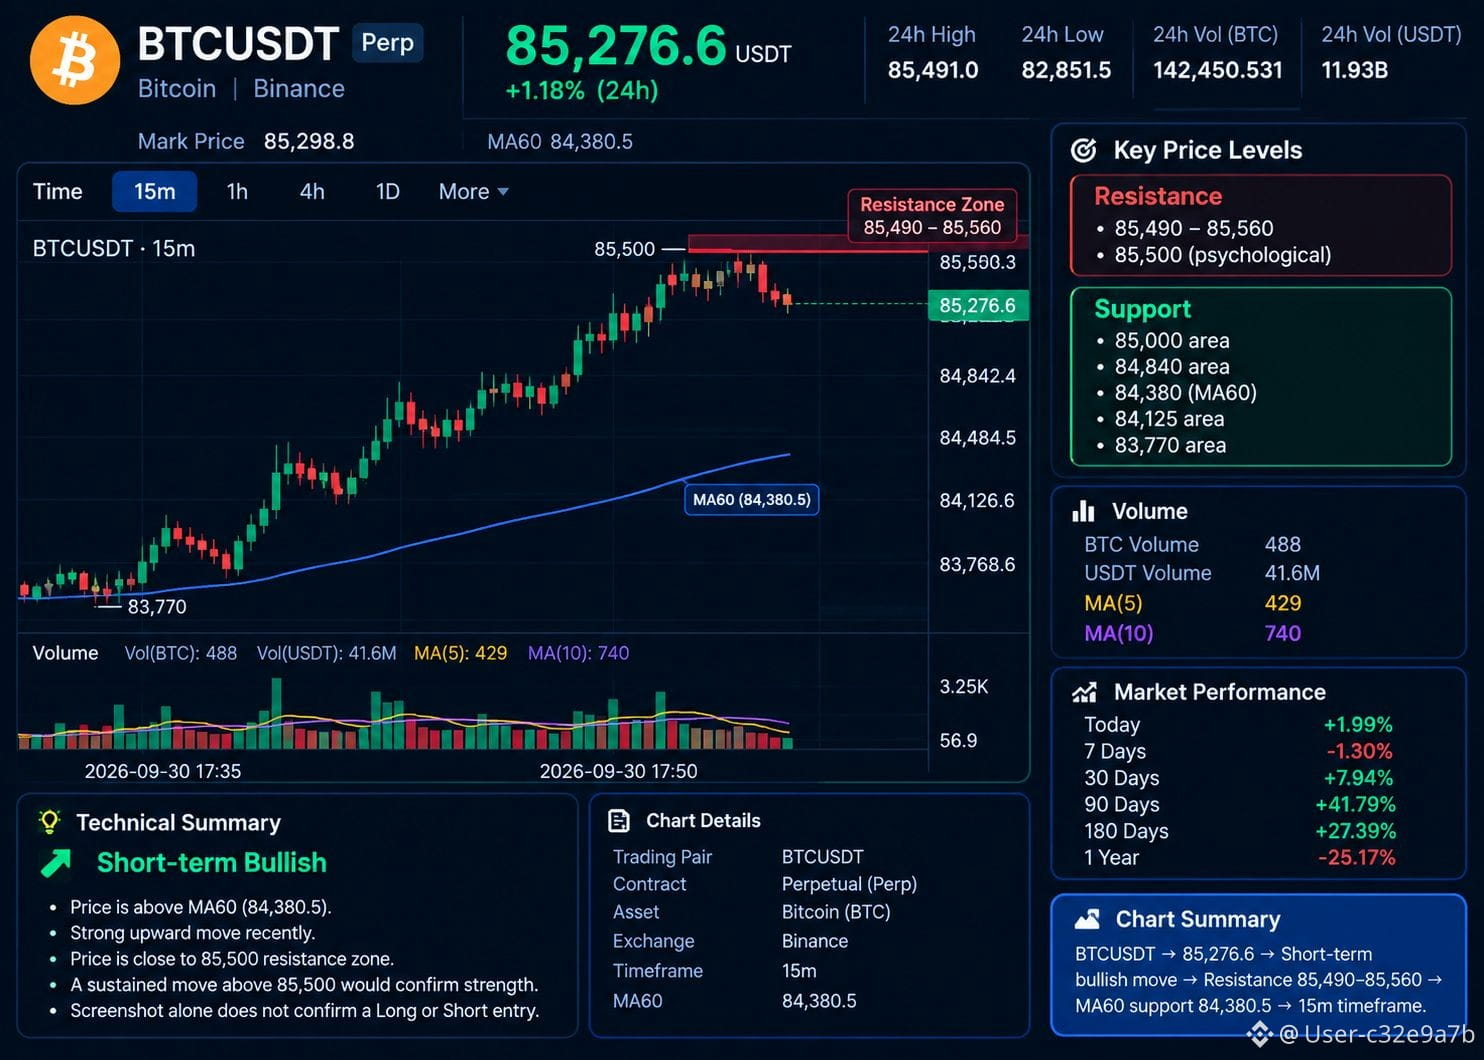
$BTC #SECToClarifyOnChainFundraisingRules #QNTRises287% — Complete Chart Details
Trading Pair: BTCUSDT
Contract: Perpetual (Perp)
Asset: Bitcoin (BTC)
Exchange: Binance
Current Market Data
Last Price: 85,276.6 USDT
Mark Price: 85,298.8 USDT
24H Change: +1.18%
24H High: 85,491.0
24H Low: 82,851.5
24H Volume (BTC): 142,450.531 BTC
24H Volume (USDT): 11.93B USDT
MA60: 84,380.5
Chart Timeframe
15-minute (15m)
The chart shows BTC making a strong upward move from around 83,700–84,000 toward the 85,400–85,500 area. After reaching that zone, price has pulled back slightly and is currently around 85,276.6.
Important Price Levels
Resistance:
85,490–85,560
85,500 is the immediate psychological resistance.
Support:
85,000 area
84,840 area
84,380 — MA60
84,125 area
83,770 area
Volume
Current BTC Volume: 488
USDT Volume: 41.6M
MA(5): 429
MA(10): 740
Market Performance
Today: +1.99%
7 Days: -1.30%
30 Days: +7.94%
90 Days: +41.79%
180 Days: +27.39%
1 Year: -25.17%
Technical Reading
The 15-minute chart is currently bullish in structure, because price is trading above the displayed MA60 (84,380.5) and has recently produced a strong upward move.
However, price is now close to the 85,500 resistance zone. A sustained move above that area would be technically different from a rejection there. The screenshot alone does not confirm a Long or Short entry.
Chart Summary:
BTCUSDT → 85,276.6 → Short-term bullish move → Resistance 85,490–85,560 → MA60 support 84,380.5 → 15m timeframe.
Trading Pair: BTCUSDT
Contract: Perpetual (Perp)
Asset: Bitcoin (BTC)
Exchange: Binance
Current Market Data
Last Price: 85,276.6 USDT
Mark Price: 85,298.8 USDT
24H Change: +1.18%
24H High: 85,491.0
24H Low: 82,851.5
24H Volume (BTC): 142,450.531 BTC
24H Volume (USDT): 11.93B USDT
MA60: 84,380.5
Chart Timeframe
15-minute (15m)
The chart shows BTC making a strong upward move from around 83,700–84,000 toward the 85,400–85,500 area. After reaching that zone, price has pulled back slightly and is currently around 85,276.6.
Important Price Levels
Resistance:
85,490–85,560
85,500 is the immediate psychological resistance.
Support:
85,000 area
84,840 area
84,380 — MA60
84,125 area
83,770 area
Volume
Current BTC Volume: 488
USDT Volume: 41.6M
MA(5): 429
MA(10): 740
Market Performance
Today: +1.99%
7 Days: -1.30%
30 Days: +7.94%
90 Days: +41.79%
180 Days: +27.39%
1 Year: -25.17%
Technical Reading
The 15-minute chart is currently bullish in structure, because price is trading above the displayed MA60 (84,380.5) and has recently produced a strong upward move.
However, price is now close to the 85,500 resistance zone. A sustained move above that area would be technically different from a rejection there. The screenshot alone does not confirm a Long or Short entry.
Chart Summary:
BTCUSDT → 85,276.6 → Short-term bullish move → Resistance 85,490–85,560 → MA60 support 84,380.5 → 15m timeframe.