



Workday stock closed at $189.17 on Tuesday, September 29, up 0.3% from $188.60. The modest move, however, masks fading near-term momentum beneath an intact longer-term uptrend.
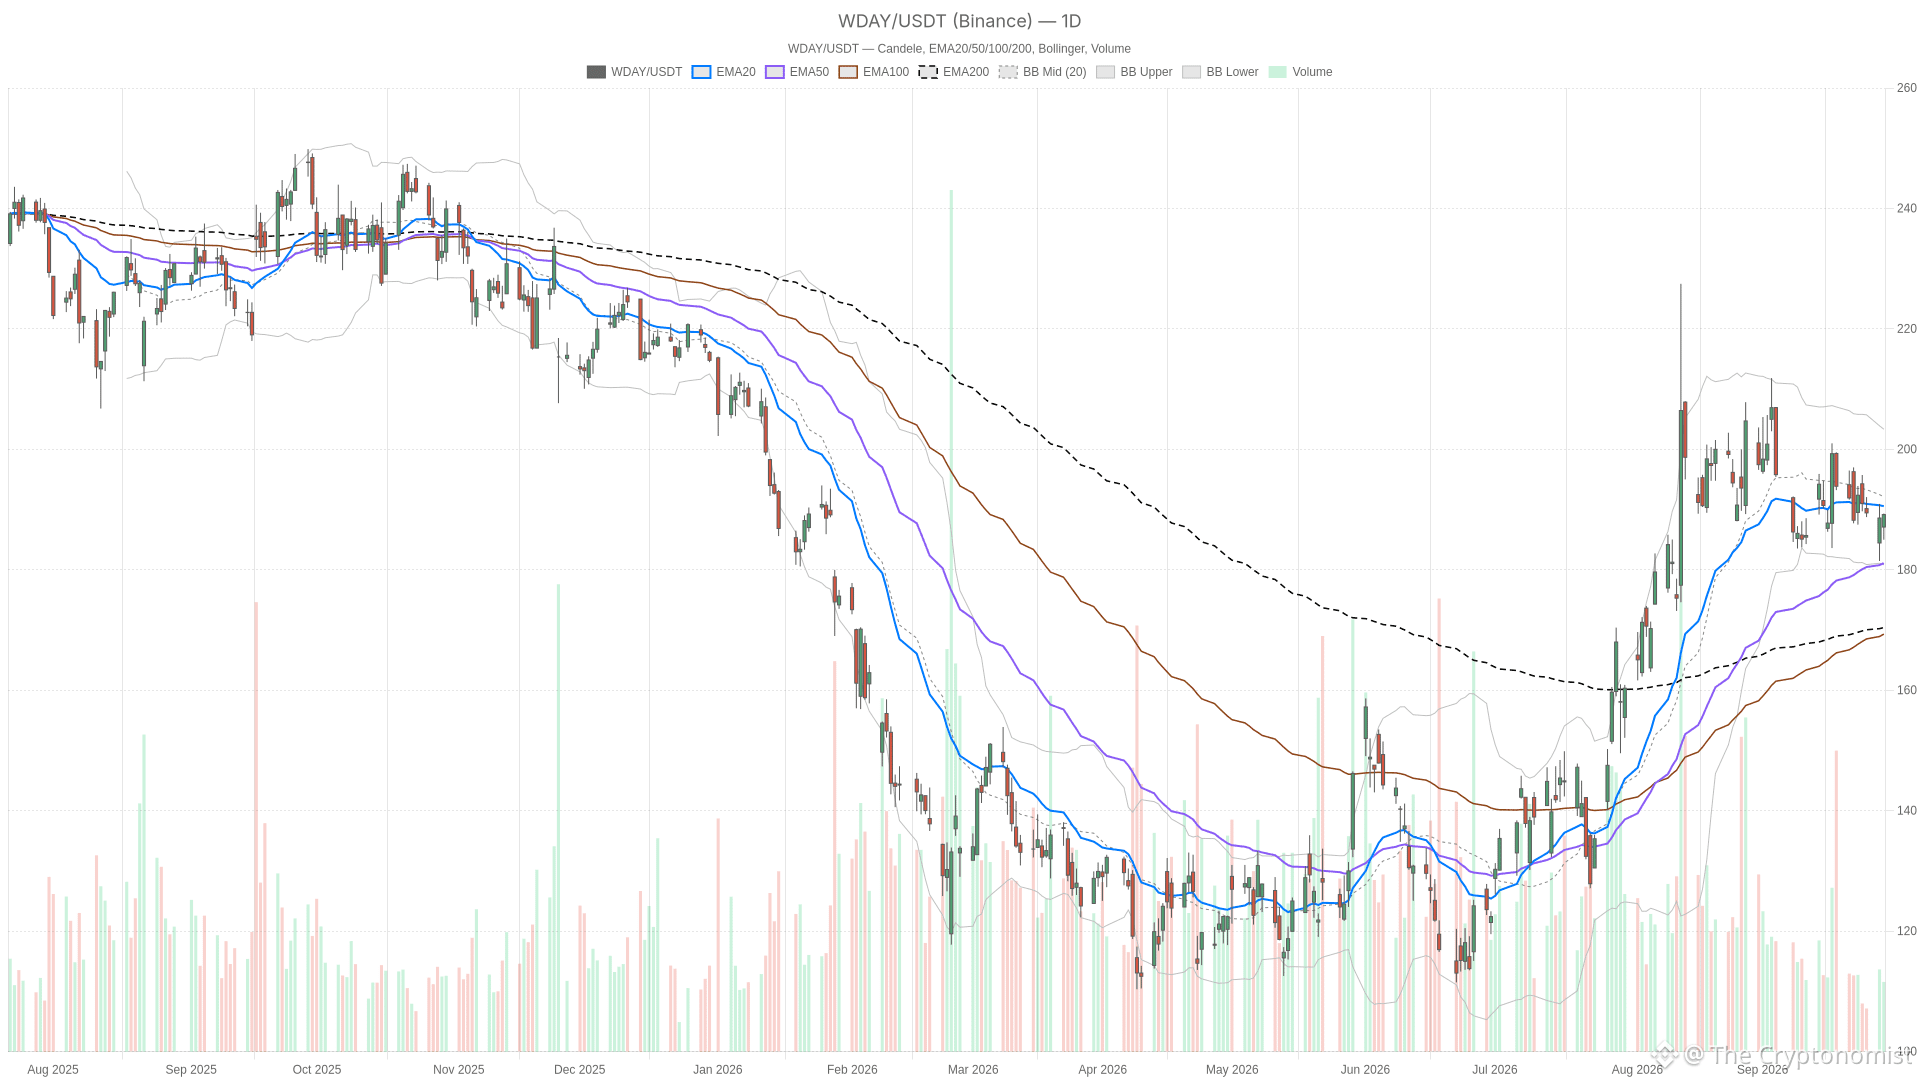 WDAY — daily chart with candlesticks, EMA20/EMA50 and volume.
Key takeaways
Workday stock closed at $189.17 on Tuesday, up 0.3%, holding above its 50-session EMA ($181.11) and 200-session EMA ($175.64).
Daily momentum is cooling: the MACD histogram sits at -1.34, and price closed below the 20-day EMA at $190.57.
After the close, Workday disclosed a 2.5% workforce reduction in Product and Technology, with $65 million to $85 million in associated charges.
The 15-minute chart shows firmer near-term momentum, but the hourly chart still has price capped below its EMA50 and EMA200.
Daily ATR14 at $7.82 and the layoff disclosure add uncertainty heading into the next session.
Daily structure: uptrend intact, but momentum is thinning
Workday stock’s daily uptrend holds above its key moving averages, but momentum indicators signal the advance is losing steam. The broader trend remains tilted higher, yet short-term readings point to a market in consolidation rather than continuation.
On the daily chart, WDAY trades above both its 50-session EMA at $181.11 and its 200-session EMA at $175.64. That alignment keeps the broader trend constructive. However, price sits below its 20-day EMA at $190.57, suggesting the stock has slipped beneath its short-term trend line.
Momentum and volatility readings point to cooling
The daily RSI14 reads 50.03, essentially neutral. That is not a signal of exhaustion or fresh strength — it simply reflects a market in balance. Meanwhile, the daily MACD tells a more cautious story: the line sits at 1.31 against a signal of 2.66, leaving a histogram of -1.34. That negative histogram points to fading bullish momentum. Still, the MACD line itself remains in positive territory relative to zero over the medium term.
Bollinger Bands on the daily timeframe show the mid-band at $192.08, with the upper band at $203.34 and the lower band at $180.82. Price closed below the mid-band, placing WDAY in the lower half of its recent volatility envelope. The daily ATR14 stands at $7.82. Single-session swings of that magnitude are normal for this stock. On the pivot grid, the daily pivot point sits at $187.84. Resistance stands at $190.67 (R1) and support at $186.33 (S1). That fairly tight band largely contained Tuesday’s action.
Hourly picture: a tentative bid, but still capped overhead
The hourly chart shows Workday stock attempting to stabilize, though overhead resistance from key EMAs keeps the broader short-term trend capped. Buyers have stepped in near the hourly EMA20, but the stock has yet to reclaim the levels that would confirm a shift in short-term control.
Price closed at $189.18, above the hourly EMA20 of $188.57, but below both the EMA50 ($190.04) and EMA200 ($189.49). In other words, short-term buyers have stepped in, yet the broader hourly trend still sits above current price. That is a classic sign of a market trying to stabilize inside a range rather than breaking cleanly higher.
Hourly RSI14 at 50.62 mirrors the daily reading: neutral, with no strong directional pull. The MACD picture on this timeframe is more interesting, however. The line at -1.00 sits just below the signal at -1.05, producing a small positive histogram of 0.05. That is a very early, tentative bullish cross forming from negative territory — worth watching, but not yet decisive. Bollinger mid-band on the hourly stands at $188.66, with price closing just above it, while the upper band sits at $191.72 and the lower band at $185.61. The hourly ATR14 of $1.99 confirms that intraday ranges have compressed relative to the daily average, consistent with a market pausing to digest recent moves.
15-minute execution context
On the 15-minute chart, Workday stock displays firmer short-term momentum, with price pushing above key period averages and the upper Bollinger Band. This faster timeframe shows a more assertive bid than the hourly or daily charts, though the move already looks stretched.
Price at $189.18 trades above both the 20-period EMA ($187.31) and the 50-period EMA ($187.89), though it remains below the 200-period EMA at $190.35. RSI14 on this timeframe reads 63.69, a level that leans bullish without yet flashing overbought extremes. The 15-minute MACD is also constructive, with the line at 0.10 above the signal at -0.27, producing a positive histogram of 0.37.
Notably, price has pushed above the 15-minute upper Bollinger Band, which sits at $188.58, against a mid-band of $186.84 and a lower band of $185.10. That kind of push above the upper band on a short-term chart often reflects a sharp, fast move that can either extend or pause for consolidation. Given the tighter 15-minute ATR14 of $0.90, near-term traders should expect any pullback toward the $188.55 pivot support (S1) to be shallow rather than a full reversal, unless broader sentiment shifts.
What could support the bullish case
For Workday stock to regain a cleanly bullish posture, it must reclaim the daily EMA20 at $190.57 and clear pivot resistance at $190.67. A close above that zone would realign the daily trend more constructively, with the stock already sitting comfortably above both the 50- and 200-session EMAs.
On the fundamental side, a Seeking Alpha piece published on September 27 argued that Workday’s AI Agent and Flex Credits subscription push positions the stock as undervalued, rating it a strong buy. Separately, the company’s rollout of an AI-powered Total Benefits offering — unifying health, financial and wellbeing programs — adds a growth narrative that bulls can point to if execution follows through.
What would invalidate the bullish view
A daily close below pivot support at $187.84 would invalidate the bullish view, confirming the recent bounce as corrective rather than the start of a new leg higher. The negative daily MACD histogram already signals that upside momentum has cooled. A failure to reclaim the EMA20 would reinforce that fading-momentum thesis.
After the Tuesday close, Workday disclosed in a securities filing that it is cutting approximately 2.5% of its workforce, affecting mainly the Product and Technology team. Associated charges of $65 million to $85 million will pressure GAAP margins going forward. Because this news broke after Tuesday’s session ended, it cannot explain that day’s price action, but it stands as a fresh input the market has not yet fully priced in. Separately, an insider sale disclosed on September 25 showed Workday director David Duffield selling $19.1 million in WDAY stock — a data point some investors may weigh alongside the layoff headline.
Positioning and volatility outlook
Overall, Workday stock sits in a genuinely mixed setup. The daily trend remains constructive above its 50- and 200-session EMAs, yet momentum has clearly cooled beneath the 20-day EMA. The hourly chart shows price still capped by its own EMA50 and EMA200. In contrast, the 15-minute chart reflects a stretched short-term push that leaves room for a pause.
Therefore, the more balanced read is one of consolidation within a defined range, bounded roughly by daily support at $186.33 and resistance at $190.67, rather than a decisive breakout in either direction. With daily ATR running near $7.82, swings of that size remain part of the normal trading rhythm here. The after-hours layoff disclosure adds a layer of uncertainty that the next full session should help clarify. As always, this is a market analysis and not investment advice.
FAQ
What is the current trend for Workday stock?
Workday stock’s daily uptrend remains intact above its 50-session EMA ($181.11) and 200-session EMA ($175.64). However, short-term momentum has faded, with price closing below the 20-day EMA ($190.57) and the daily MACD histogram turning negative at -1.34.
What layoff news did Workday announce after Tuesday’s close?
Workday disclosed in a securities filing a workforce reduction of approximately 2.5%, mainly affecting the Product and Technology team. Associated charges are estimated between $65 million and $85 million, which will pressure GAAP margins in upcoming quarters.
What are the key levels to watch on Workday stock?
Key resistance sits at the daily EMA20 ($190.57) and pivot R1 ($190.67). Support lies at the daily pivot ($187.84) and S1 ($186.33). A close above resistance would realign the trend more cleanly bullish, while a break below support would confirm the fading-momentum thesis.
Disclaimer: This article is for informational purposes only and does not constitute financial advice, an investment recommendation, or a solicitation to buy or sell any financial instrument or cryptocurrency. The analysis provided is not indicative of future results. Investing in crypto assets and financial markets carries a high risk of capital loss. Always do your own research (DYOR) and consult a qualified financial advisor before making any decision.
Article produced with the assistance of artificial intelligence and reviewed by the editorial team.