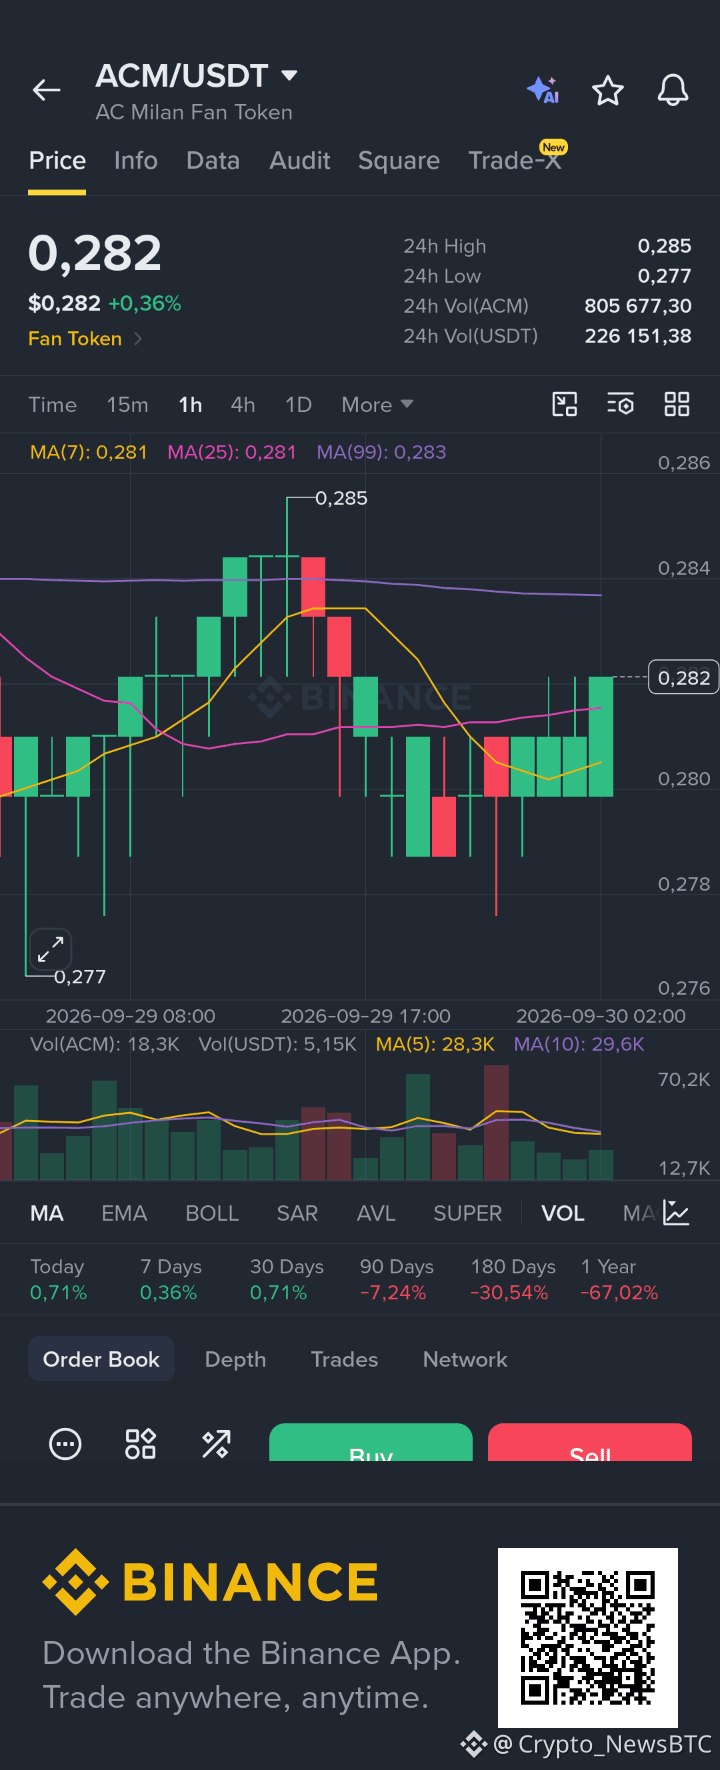
$ACM is trading near 0.282 on the 1h chart, between a 24h low of 0.277 and a high of 0.285.
Price sits above the MA(7) and MA(25) at 0.281, with the MA(99) at 0.283 as the first resistance just overhead.
My read: hourly closes above 0.283, then 0.285, would strengthen the bullish case. A break below 0.280 reopens a retest of 0.277.
Volume on recent candles is weaker than today's peaks, and the higher-timeframe trend is still down (-30% over 180 days), so I'd wait for volume confirmation before drawing conclusions.
Which support level are you watching?
Personal opinion, not financial advice.
$ACM
Price sits above the MA(7) and MA(25) at 0.281, with the MA(99) at 0.283 as the first resistance just overhead.
My read: hourly closes above 0.283, then 0.285, would strengthen the bullish case. A break below 0.280 reopens a retest of 0.277.
Volume on recent candles is weaker than today's peaks, and the higher-timeframe trend is still down (-30% over 180 days), so I'd wait for volume confirmation before drawing conclusions.
Which support level are you watching?
Personal opinion, not financial advice.
$ACM