

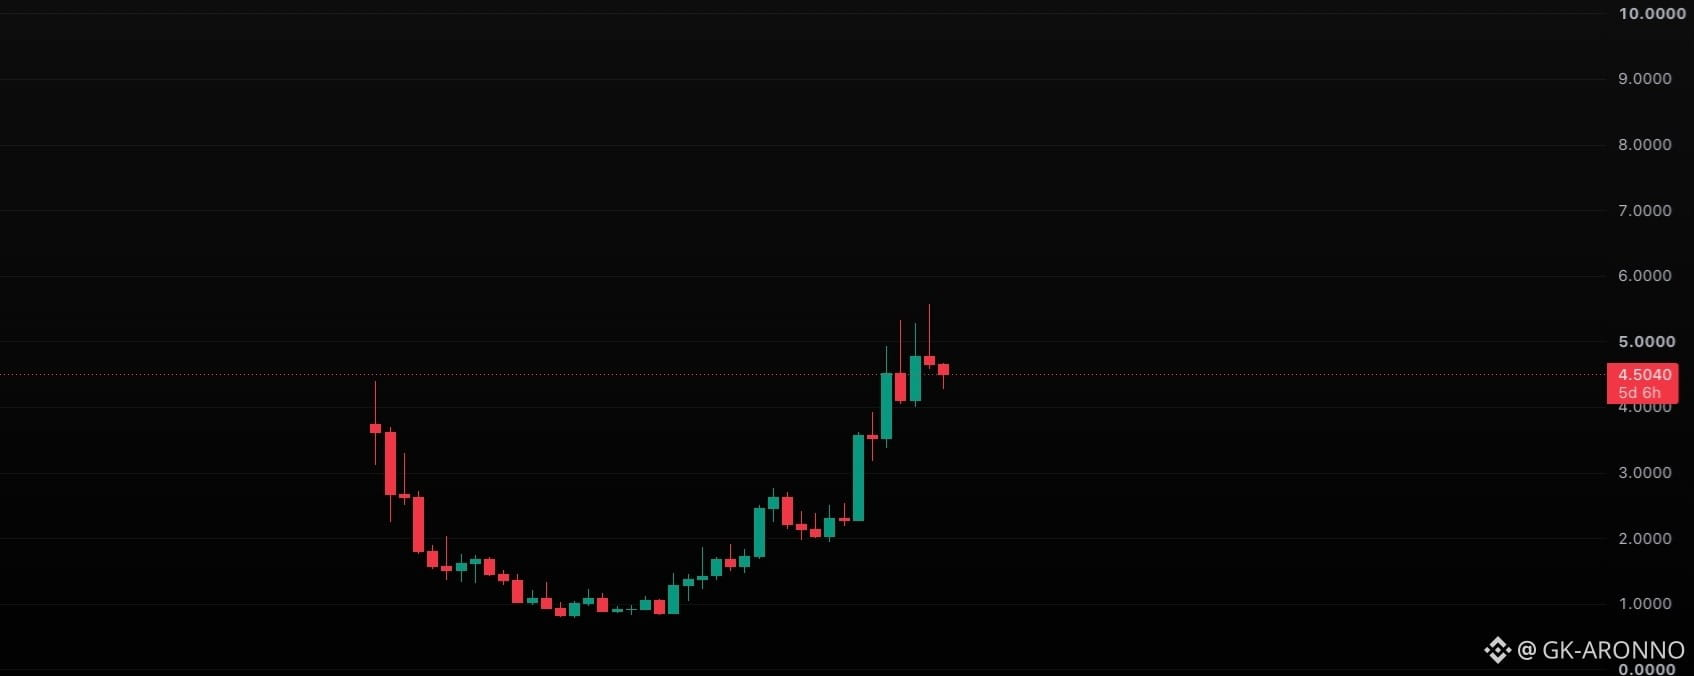

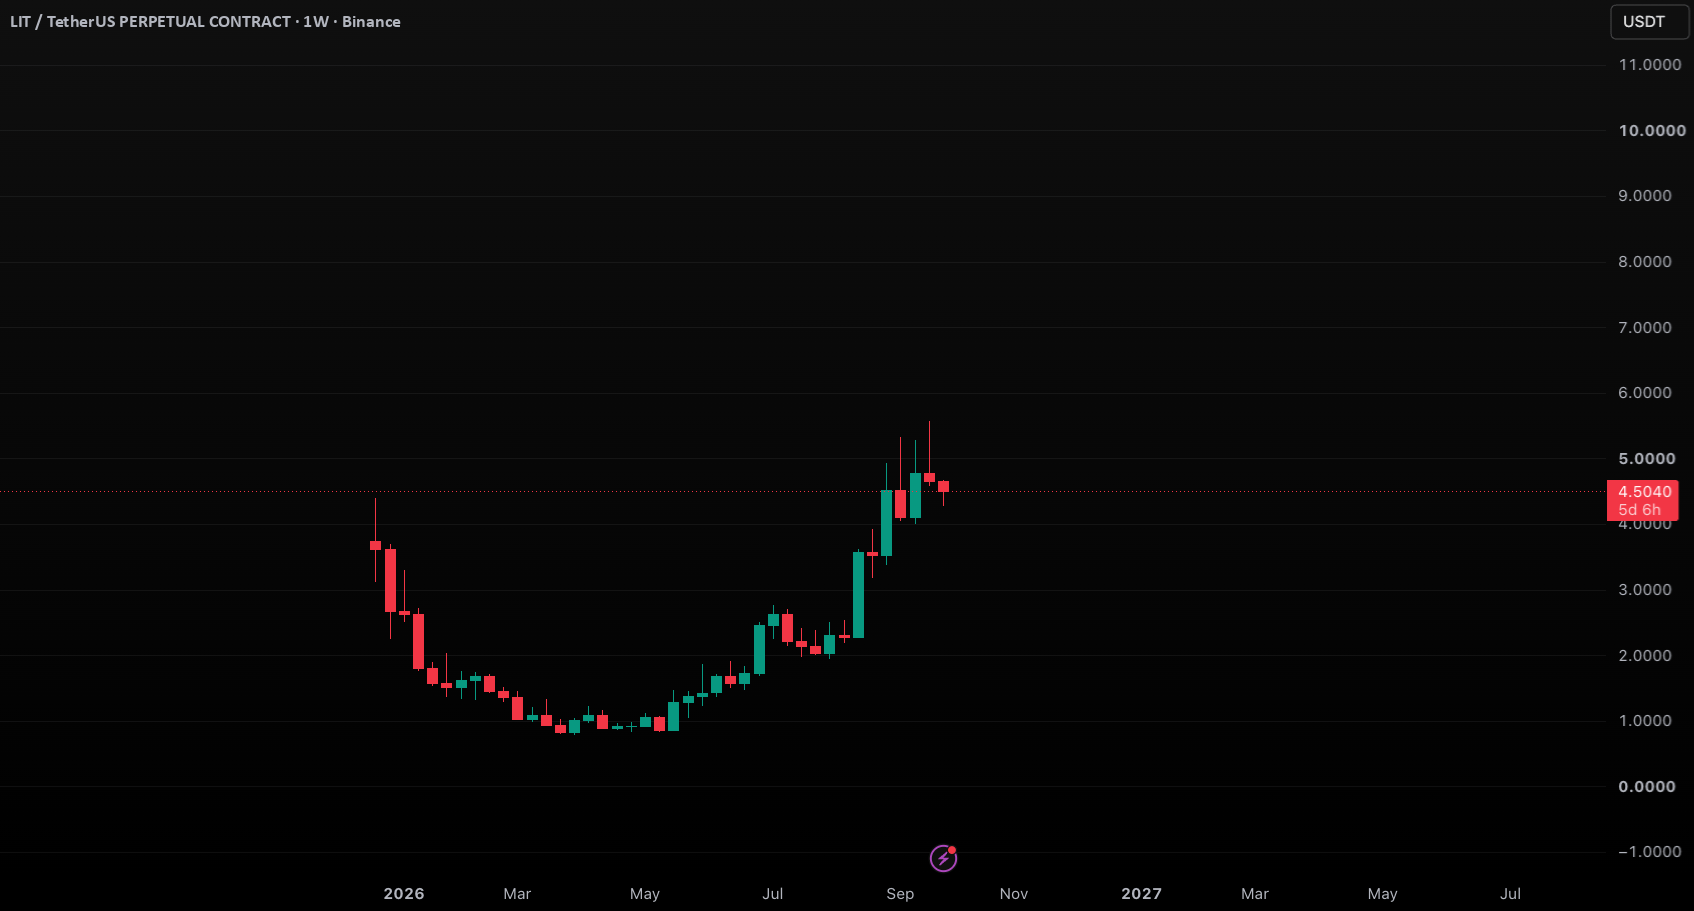
I have identified the pattern on your chart and calculated the potential targets. Based on the depth of the cup from the bottom (~0.80) to the neckline rim (~5.00), the pattern depth is 4.20. The target is projected from the breakout point, leading to a potential target of 9.20.
Here is the chart with the key elements drawn and labeled for you:
Cup: Outlined in light blue.
Handle: Outlined in orange.
Neckline (Breakout Point): Horizontal red line at 5.00.
Profit Target: Dashed green line at 9.20, with measurement brackets showing the calculation. LITUSDT.P

LITUSDT
Perp
3.9415
-11.85%