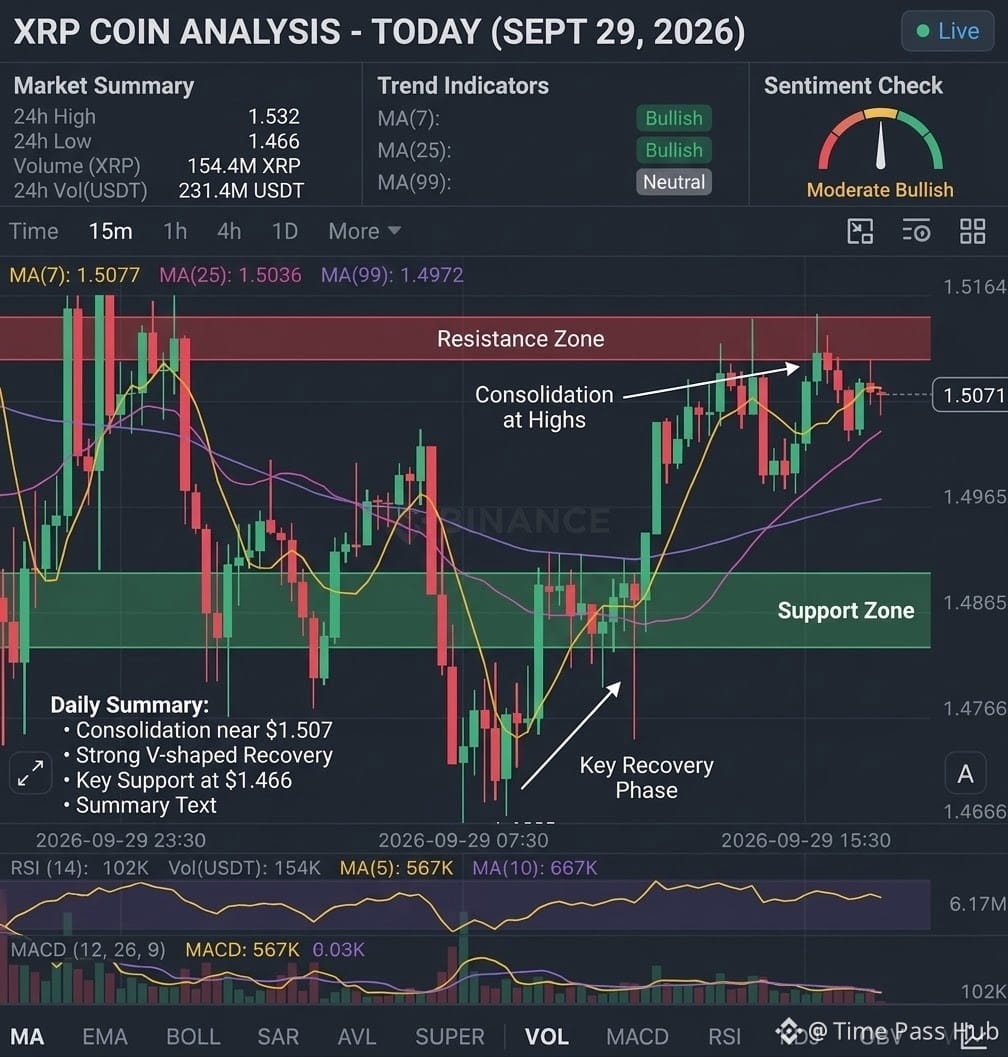
$XRP is currently consolidating around $1.507, recovering from a recent daily low near $1.466.
Based on the 15-minute chart provided, here is a technical analysis of the current market structure:
1. Price Action & Trend
* Current Level: $1.5071 (+1.13% on the session).
* 24-Hour Range: Low of $1.4663 to High of $1.5324.
* Short-Term Recovery: Following a sharp sell-off down to $1.466 (07:30 UTC), price staged a strong V-shaped recovery, sweeping back above $1.516 before minor pullbacks.
2. Moving Average Status (15m Timeframe)
* MA(7) (Yellow): 1.5077 — Price is currently hovering right at the 7-period moving average, showing local consolidation.
* MA(25) (Purple): 1.5036 — Acts as immediate dynamic short-term support.
* MA(99) (Purple/Dark): 1.4972 — Trendline support lies below, indicating the short-term bias remains constructive as long as price holds above $1.497.
3. Support & Resistance Levels
* Immediate Resistance: $1.516 – $1.532 (Recent local swing high & 24h high). A breakout above this targets $1.55 – $1.60.
* Immediate Support: $1.503 (MA25) followed by $1.497 (MA99).
* Key Swing Floor: $1.466 (24h Low). Losing this level opens downside risk toward $1.43.
4. Volume & Momentum
* Volume: Spike in buying volume occurred during the bounce from $1.466, but trading volume has since tapered off near current highs, suggesting momentum is cooling into a tight consolidation pattern.
Summary Strategy Outlook
* Bullish Scenario: A sustained 15m candle close above $1.516 confirms buyer control, opening a path toward testing $1.532+.
* Bearish Scenario: Slipping below $1.497 signals weak momentum, potentially retesting the major demand floor at $1.466.
#xrp #analysis #Market_Update #Binance #Write2Earn
$XRP
$CELO
Based on the 15-minute chart provided, here is a technical analysis of the current market structure:
1. Price Action & Trend
* Current Level: $1.5071 (+1.13% on the session).
* 24-Hour Range: Low of $1.4663 to High of $1.5324.
* Short-Term Recovery: Following a sharp sell-off down to $1.466 (07:30 UTC), price staged a strong V-shaped recovery, sweeping back above $1.516 before minor pullbacks.
2. Moving Average Status (15m Timeframe)
* MA(7) (Yellow): 1.5077 — Price is currently hovering right at the 7-period moving average, showing local consolidation.
* MA(25) (Purple): 1.5036 — Acts as immediate dynamic short-term support.
* MA(99) (Purple/Dark): 1.4972 — Trendline support lies below, indicating the short-term bias remains constructive as long as price holds above $1.497.
3. Support & Resistance Levels
* Immediate Resistance: $1.516 – $1.532 (Recent local swing high & 24h high). A breakout above this targets $1.55 – $1.60.
* Immediate Support: $1.503 (MA25) followed by $1.497 (MA99).
* Key Swing Floor: $1.466 (24h Low). Losing this level opens downside risk toward $1.43.
4. Volume & Momentum
* Volume: Spike in buying volume occurred during the bounce from $1.466, but trading volume has since tapered off near current highs, suggesting momentum is cooling into a tight consolidation pattern.
Summary Strategy Outlook
* Bullish Scenario: A sustained 15m candle close above $1.516 confirms buyer control, opening a path toward testing $1.532+.
* Bearish Scenario: Slipping below $1.497 signals weak momentum, potentially retesting the major demand floor at $1.466.
#xrp #analysis #Market_Update #Binance #Write2Earn
$XRP
$CELO