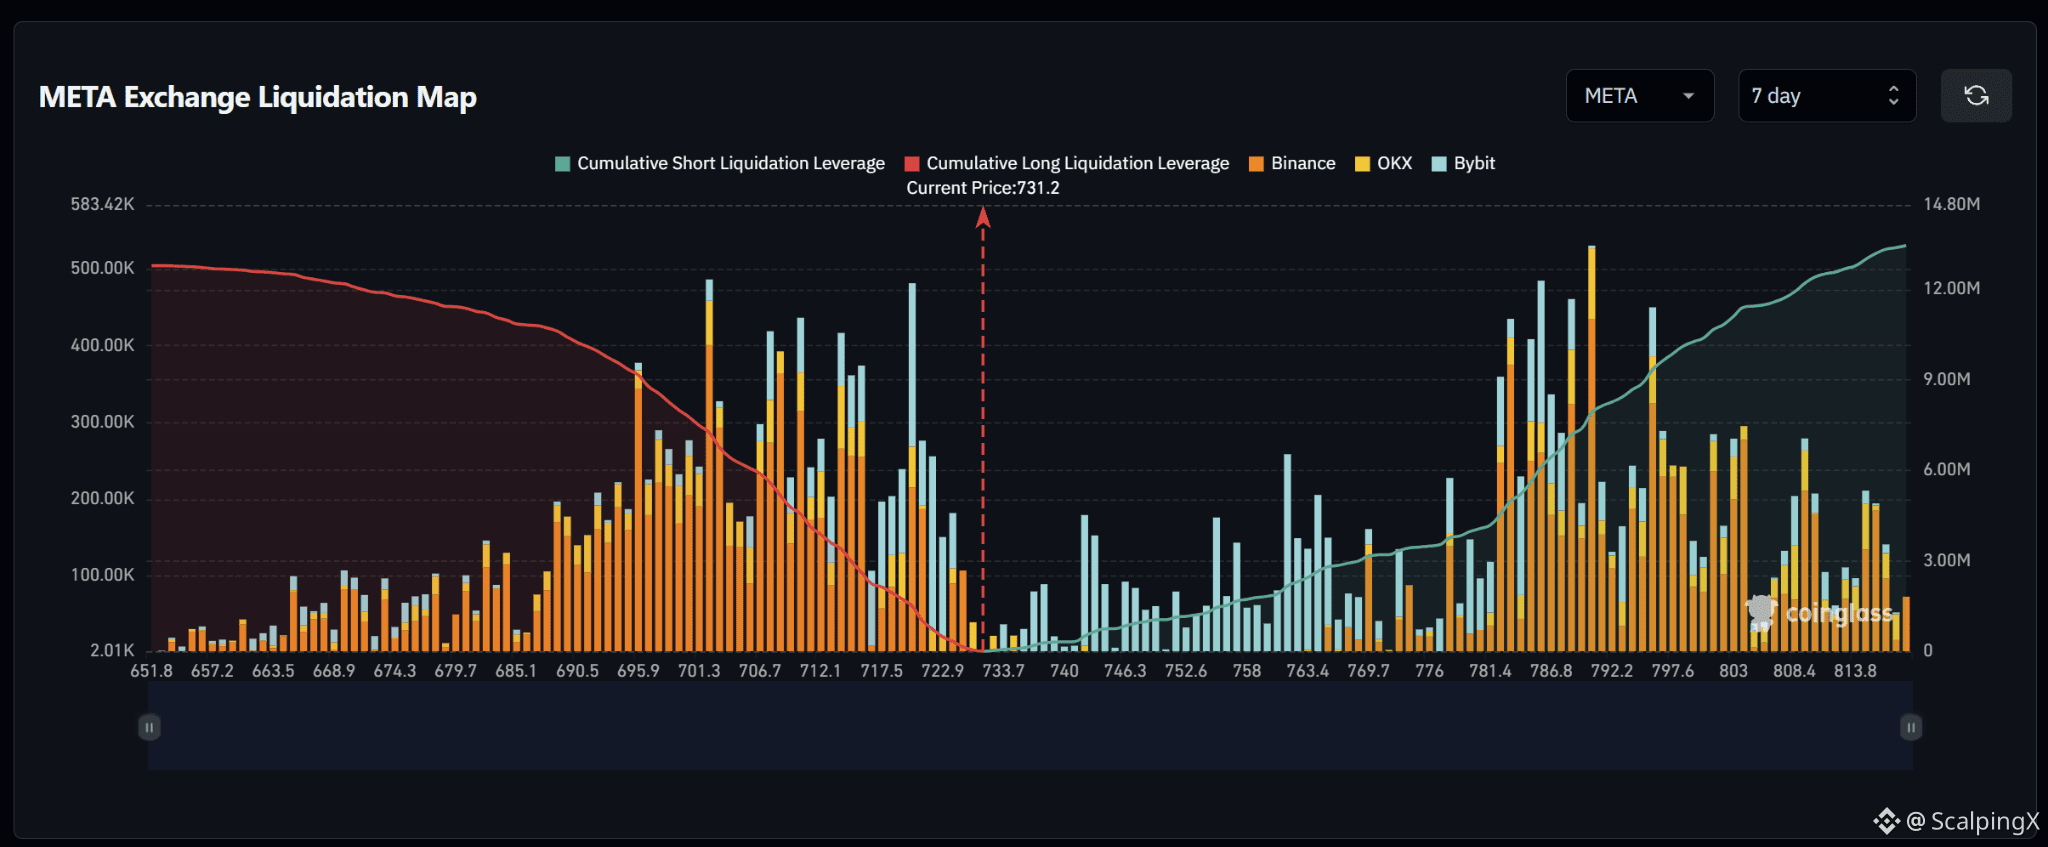
$META – Liquidation Map (7 Days) – Current Price 731.2
🔎 The 7-day liquidation map is relatively balanced on both sides, with roughly 13–14 million USD in short liquidations above the current price and around 12–13 million USD in long liquidations below. Short-liquidation exposure is slightly larger, giving the map a mild upside tilt rather than a strong imbalance.
📉 Below the market, long-liquidation liquidity is concentrated heavily across 695–723. A major cluster sits around 701–702 with a bar close to 0.48 million USD; the 706–713 area contains several bars around 0.35–0.43 million USD, while 717–719 holds another bar near 0.48 million USD. Losing 723 would shift attention toward 717–712 and then 702–696.
📈 Above the market, short-liquidation liquidity is concentrated across 781–798. Strong clusters appear around 786–787 and 790–792, with the largest bar above 0.5 million USD; 796–798 also contains a bar near 0.45 million USD. Further out, 802–814 still holds multiple smaller liquidity pockets.
🧭 The broader setup has a mild upside tilt. Breaking above 746–752 would expose 763–770, followed by the major 781–792 liquidity zone. Losing 723 would instead increase the probability of a sweep toward 717–712 and then 702–696.
🔎 The 7-day liquidation map is relatively balanced on both sides, with roughly 13–14 million USD in short liquidations above the current price and around 12–13 million USD in long liquidations below. Short-liquidation exposure is slightly larger, giving the map a mild upside tilt rather than a strong imbalance.
📉 Below the market, long-liquidation liquidity is concentrated heavily across 695–723. A major cluster sits around 701–702 with a bar close to 0.48 million USD; the 706–713 area contains several bars around 0.35–0.43 million USD, while 717–719 holds another bar near 0.48 million USD. Losing 723 would shift attention toward 717–712 and then 702–696.
📈 Above the market, short-liquidation liquidity is concentrated across 781–798. Strong clusters appear around 786–787 and 790–792, with the largest bar above 0.5 million USD; 796–798 also contains a bar near 0.45 million USD. Further out, 802–814 still holds multiple smaller liquidity pockets.
🧭 The broader setup has a mild upside tilt. Breaking above 746–752 would expose 763–770, followed by the major 781–792 liquidity zone. Losing 723 would instead increase the probability of a sweep toward 717–712 and then 702–696.