
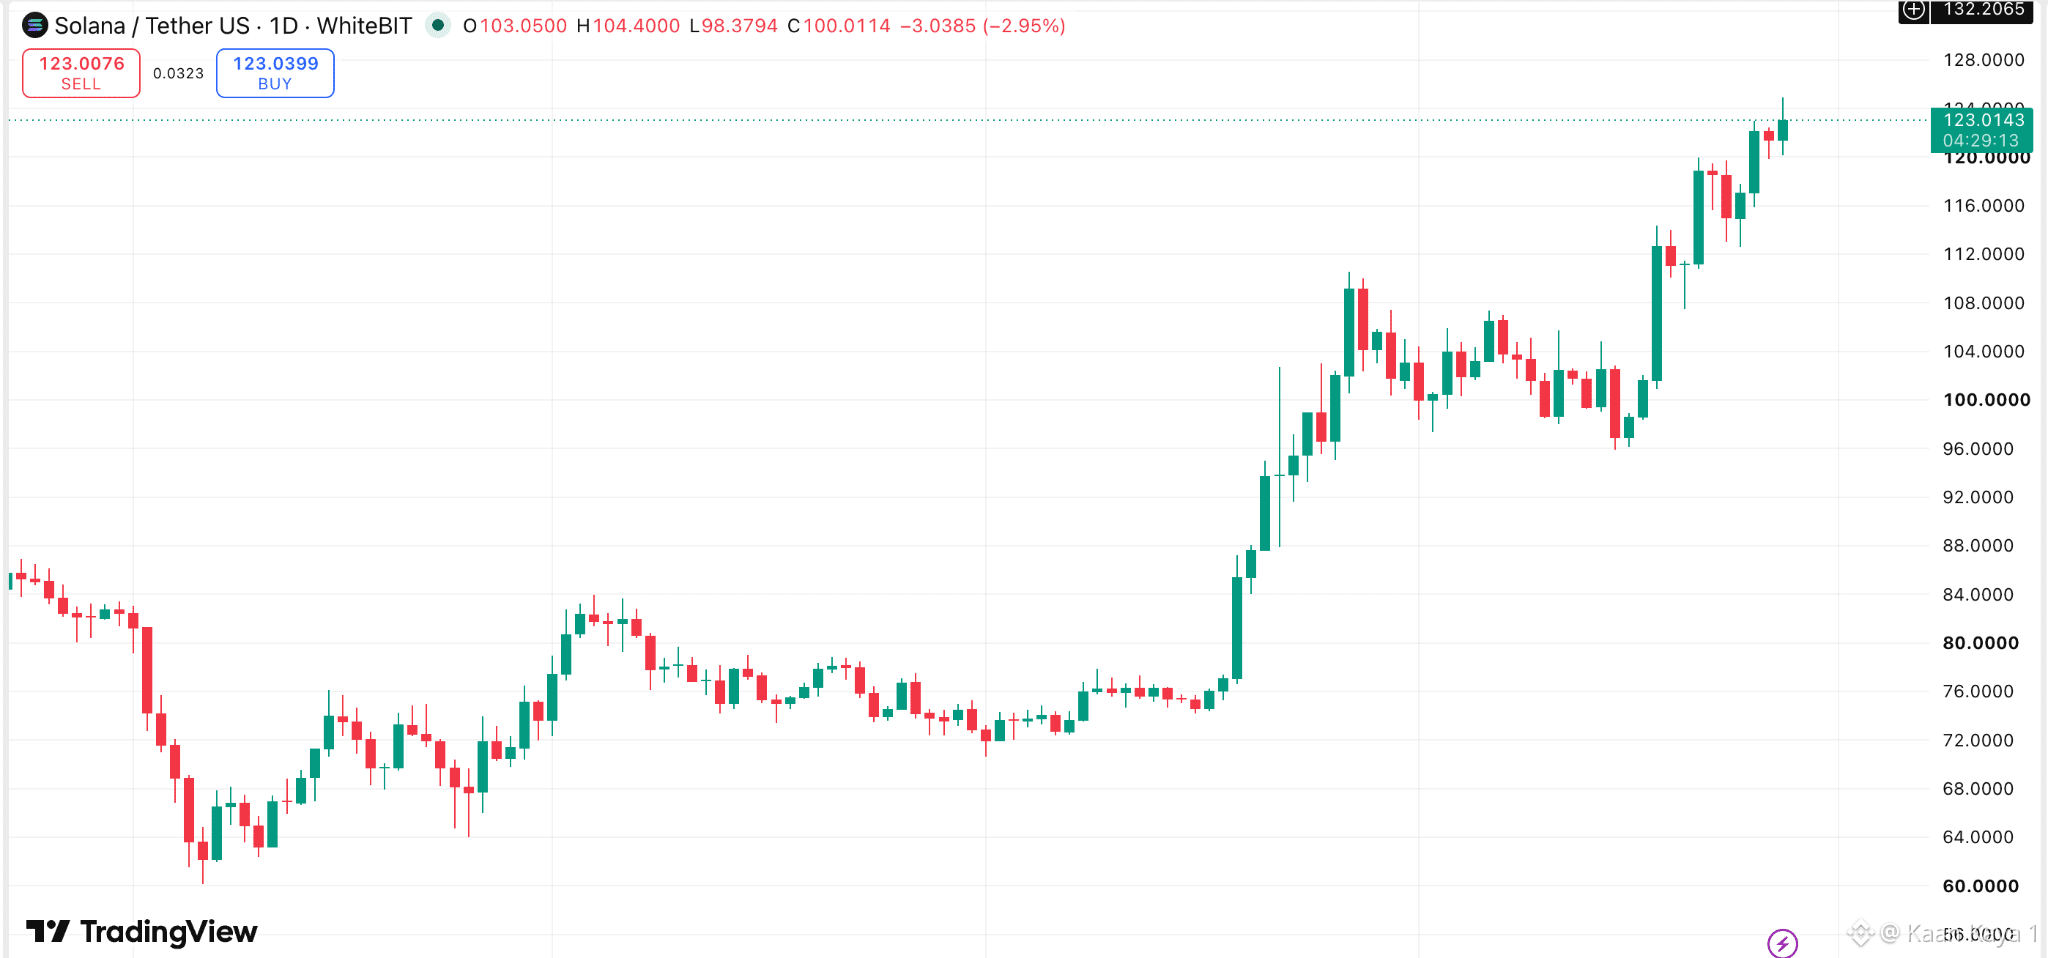
$SOL Is Back Above $120, But The Chart Isn’t The Whole Story This $SOL chart has changed pretty quickly. After spending much of the earlier period around $70–$80, Solana pushed through $100 and is now trading around $123, with the latest leg coming after a relatively short consolidation around the $100 area. There’s also fresh demand showing up away from the spot chart. U.S. spot Solana ETFs recorded $86.7 million of net inflows on Friday, their biggest single day since launch. Weekly inflows reached $188.2 million, while combined assets climbed to a record $1.5 billion. That makes the recent move a little more interesting than price alone. $SOL has broken higher while a new pool of capital is simultaneously building exposure through regulated products. The chart is already pricing in plenty of optimism, though. After a move this fast, I'd be paying less attention to whether $SOL can print another green candle and more to whether buyers keep showing up when the first proper pullback arrives. #Macro Insights# #Altcoin Season#


Veröffentlichen
Haftungsausschluss: Enthält Meinungen von Drittanbietern. Keine Beratung. Binance AI wird ohne Gewähr bereitgestellt. Siehe AGB.