


Part 1 showed the same LTH SOPR data backing two opposite calls in June 2026, and a changed market shifting a metric's meaning. Its own math can shift it too.
The blind spot of Realized Price metrics
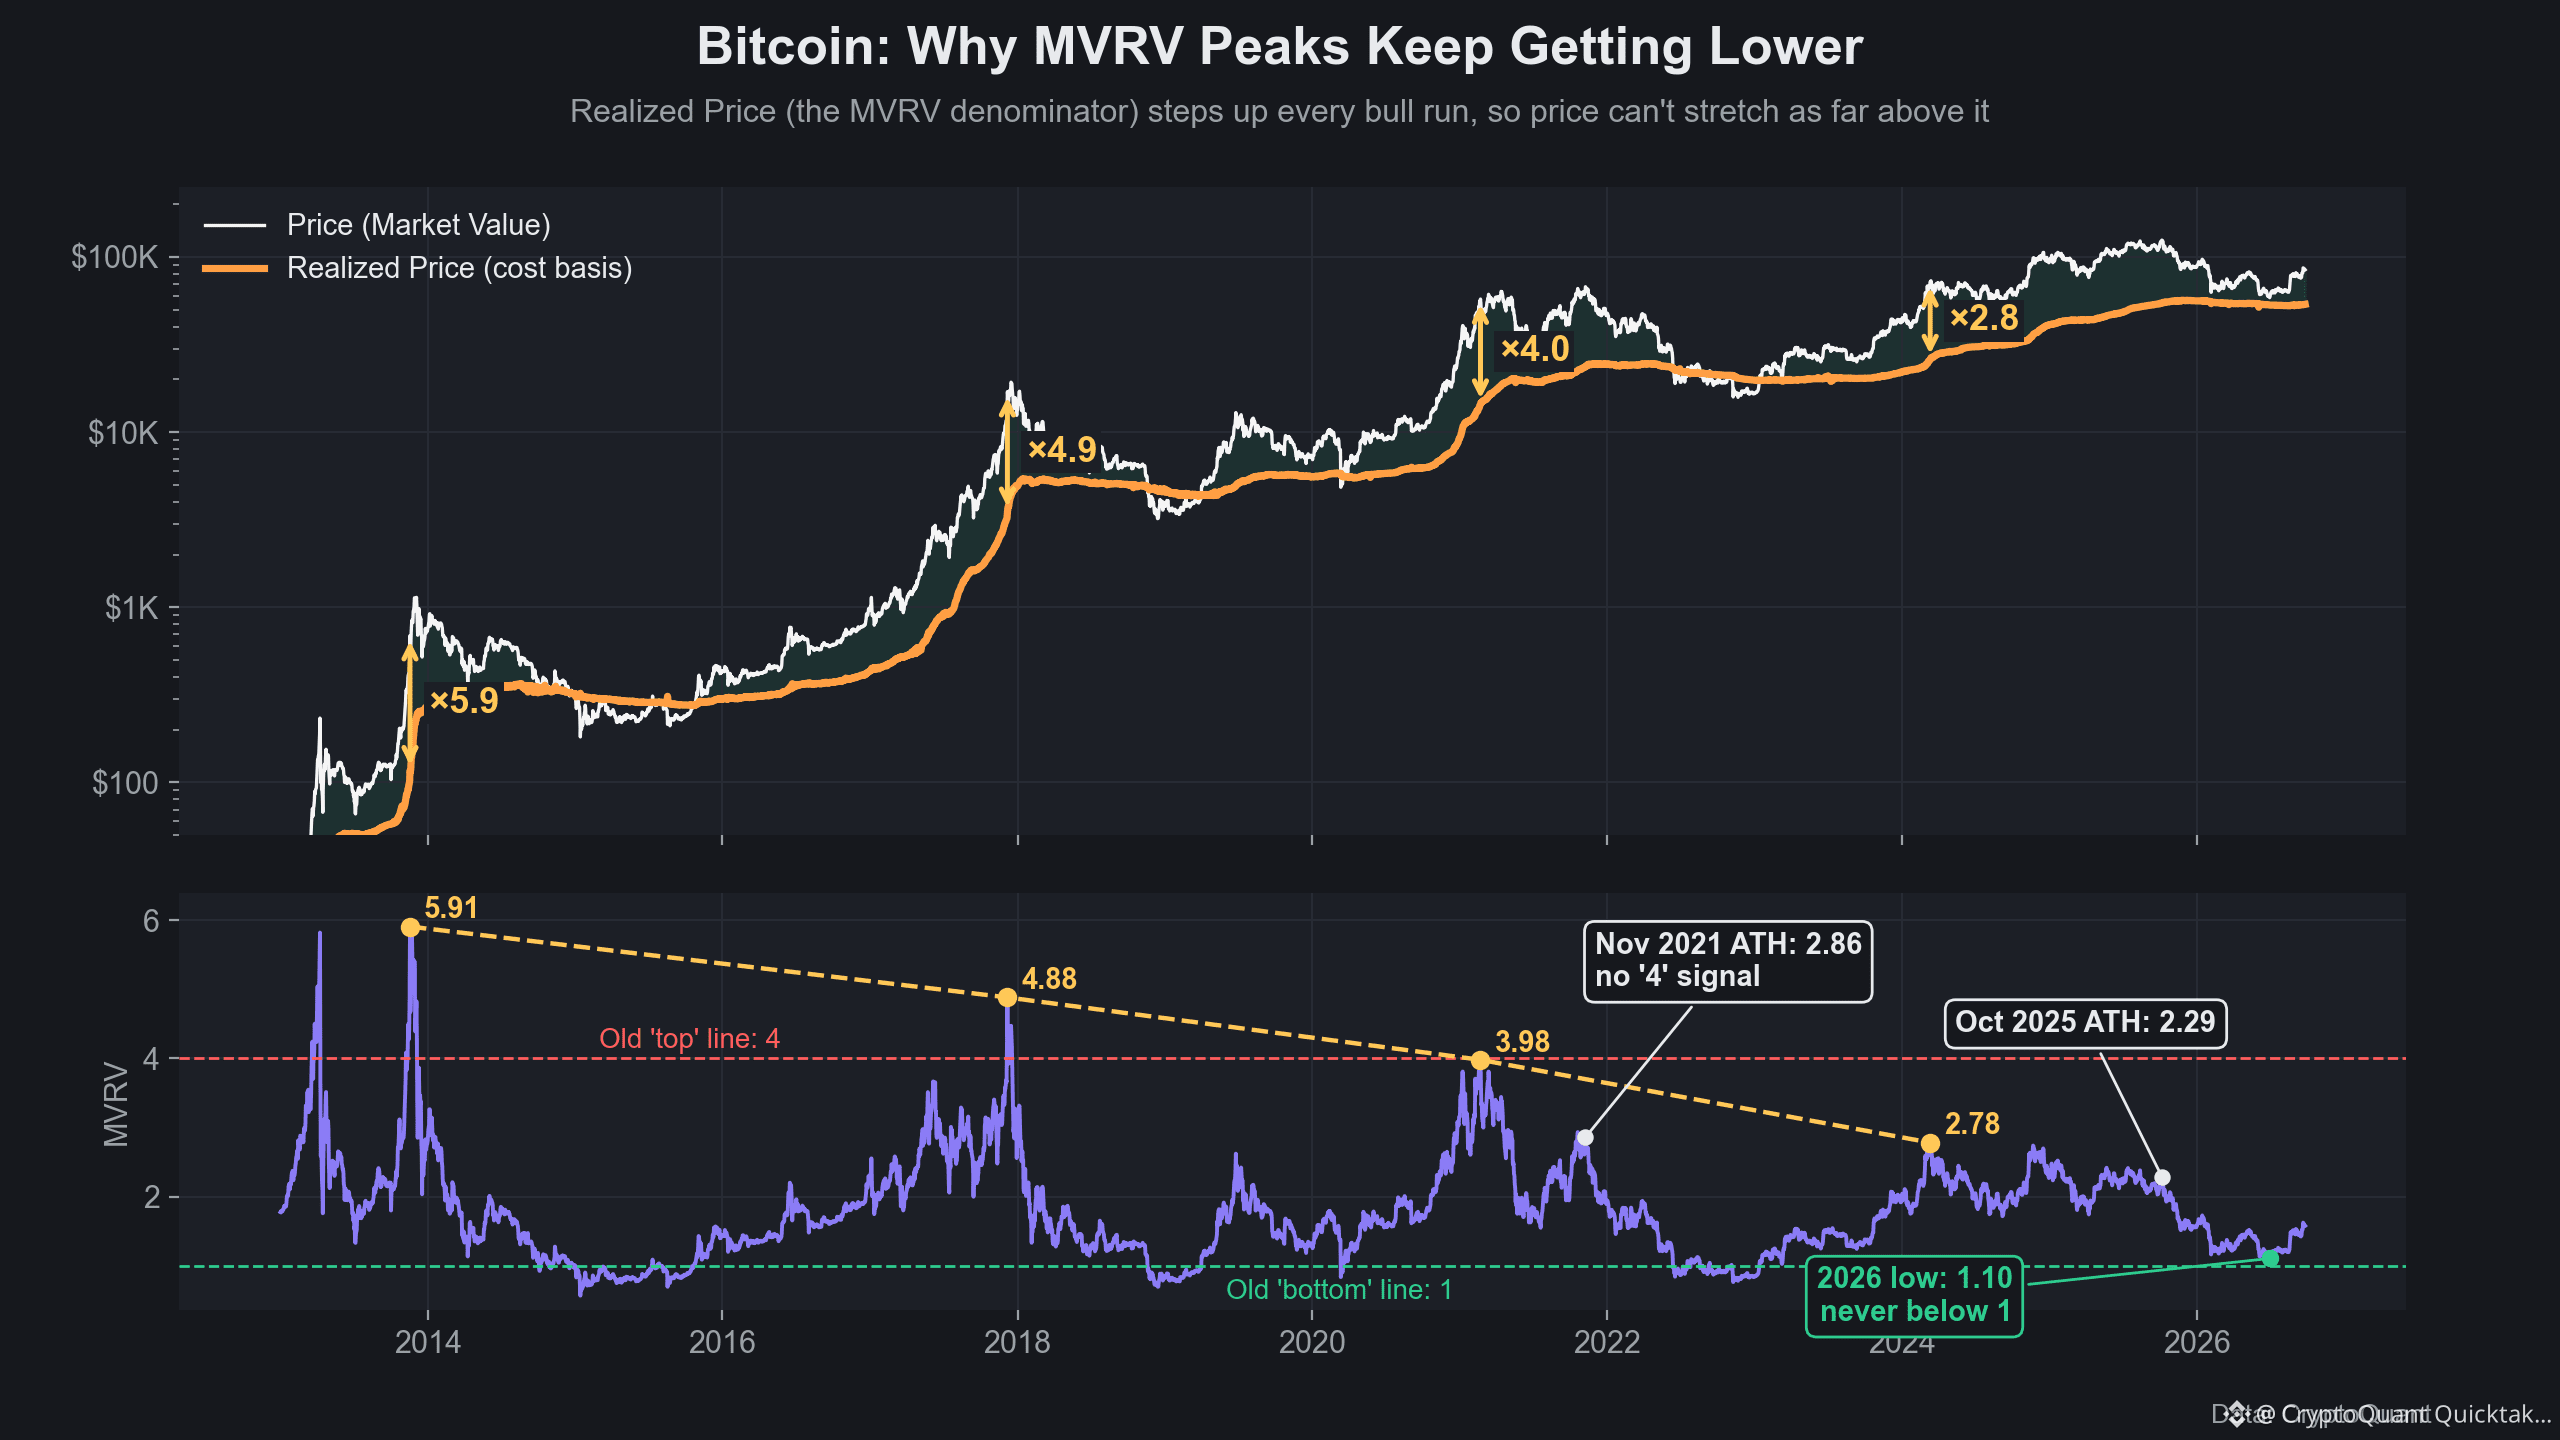
The MVRV chart doesn't label any value as a top or bottom, but it color-codes the zones above 4 and below 1, because in past cycles those zones sat near tops and bottoms. That is an answer key fitted to past cases.
Anyone waiting for the fixed MVRV 4 threshold could not have exited in late 2021.
The root cause is the denominator. Realized Price averages the price at which each coin last moved, so as a bull market sets higher highs step by step, Realized Price climbs sharply too. Late in a cycle, the denominator has been repriced at high levels for a long time, while market cap no longer has the momentum to stretch as far above it as before. So MVRV peaks keep getting lower.
Would lowering the threshold to 3 or 2.5 fix it? No. A lower threshold just fires somewhere mid-bull; the core flaw of going blind late in the cycle remains. Relying on a fixed threshold of a single metric may stay risky in future cycles too.
By the same logic, anyone waiting for MVRV below 1 could not have bought even once in 2026.
Written by AbstractRyu