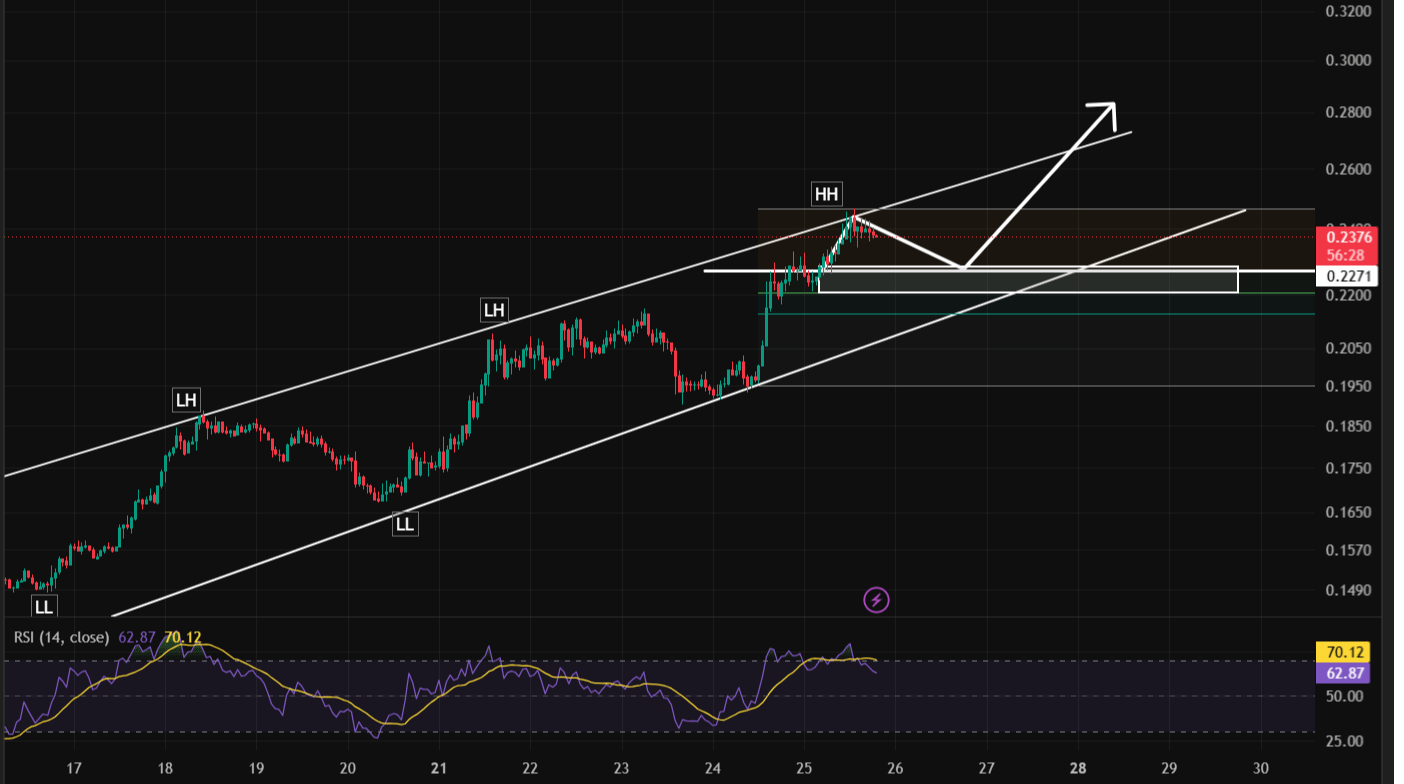


Fetch.ai (FET) is holding the higher-timeframe trend structure intact after tagging a fresh Higher High near $0.2405. Price is now cooling off into a well-defined support shelf, and the setup on the 1H chart is shaping into a classic pullback-before-continuation pattern.
Market Structure Overview
FET/USDT (Perpetual Futures, Binance, 1H timeframe) has completed a clean shift in trend structure:
Earlier price action printed a sequence of Lower Lows (LL) and Lower Highs (LH), confirming the prior downtrend from the $0.30 region down toward the $0.145 base.
Around the $0.145–$0.155 zone, buyers stepped in decisively, breaking the downtrend structure and initiating a new ascending channel.
The rally accelerated sharply after reclaiming the $0.20 handle, culminating in a Higher High (HH) near $0.2405 — the strongest signal yet that momentum has flipped in favor of the bulls.
Price is currently trading at $0.2383, consolidating just beneath that HH after a mild -0.33% pullback.
This is textbook trend-reversal behavior: LL → LH → LL → LH → HH. As long as price respects the rising trendline and the support shelf below, the structure favors continuation to the upside.
The Key Zone to Watch
The chart highlights a critical support/demand shelf between $0.2200 and $0.2271. This zone matters for two reasons:
It was the prior resistance area before the breakout to the HH, meaning it should now act as support (a classic "resistance-turned-support" flip).
It sits directly on top of the rising trendline that has guided this entire move since the $0.145 low, giving the zone extra confluence.
Below that, a secondary support line near $0.2170 marks the point where the broader bullish structure would be invalidated if lost with strength.
Momentum Check (RSI)
The RSI (14) is currently reading 64.45, with its moving average at 70.79. Momentum is bullish but not yet in extreme overbought territory, which leaves room for either:
A shallow retracement into the support shelf to "reset" momentum before the next leg, or
A direct continuation if buyers refuse to let price drop back into the shelf at all.
Either scenario keeps the broader bullish bias intact unless support fails.
Trade Setup: Entry, Targets & Invalidation
Bias: Bullish continuation, contingent on the $0.2200–$0.2271 shelf holding.
Entry Zone (preferred, retest-based):
$0.2200 – $0.2271 on a pullback into the support shelf, ideally with a bullish rejection candle (long lower wick / bullish engulfing) confirming buyers are defending the level.
Alternative Entry (breakout-based, more aggressive):
A confirmed 1H close above $0.2405 (the current HH) with rising volume, adding exposure on a retest of that level as new support.
Stop-Loss / Invalidation:
Below $0.2170, under the secondary support line. A decisive close below this level would break the ascending structure and invalidate the bullish thesis.
Take-Profit Targets:
Target 1: $0.2600 — first measured resistance extension.
Target 2: $0.2800 — aligns with the projected continuation move shown by the chart's trend extension, and a natural round-number liquidity zone.
Risk-to-Reward: Using the $0.2271 entry with a $0.2170 stop and a $0.2800 target, the setup offers roughly a 1:5 risk-to-reward ratio — favorable enough to justify a modest position size even with a tight stop.
Key Levels Summary
Resistance: $0.2405 (HH) → $0.2600 → $0.2800
Support: $0.2271 → $0.2200 → $0.2170 (invalidation)
Current Price: $0.2383
What Could Invalidate This Setup
A sharp 1H close below $0.2170 would break the ascending trendline and shift structure back toward neutral/bearish, favoring a deeper retracement toward $0.20 or lower.
A failure to reclaim $0.2405 after multiple attempts, combined with fading RSI, could signal exhaustion rather than continuation.
Final Thoughts
FET/USDT is showing one of the cleaner trend-reversal structures on the board right now — a full transition from lower lows to higher highs, backed by a defended support shelf and momentum that still has room to run before overbought conditions kick in. Patient traders may prefer to wait for a retest of the $0.22 zone before entering, while momentum traders can track a breakout-and-retest of $0.2405 instead.
Disclaimer: This article is for informational and educational purposes only and does not constitute financial advice. Cryptocurrency trading, especially with leverage/perpetual futures, carries significant risk of loss. Always conduct your own research (DYOR) and consult a licensed financial advisor before making any trading decisions. It is what it is.