

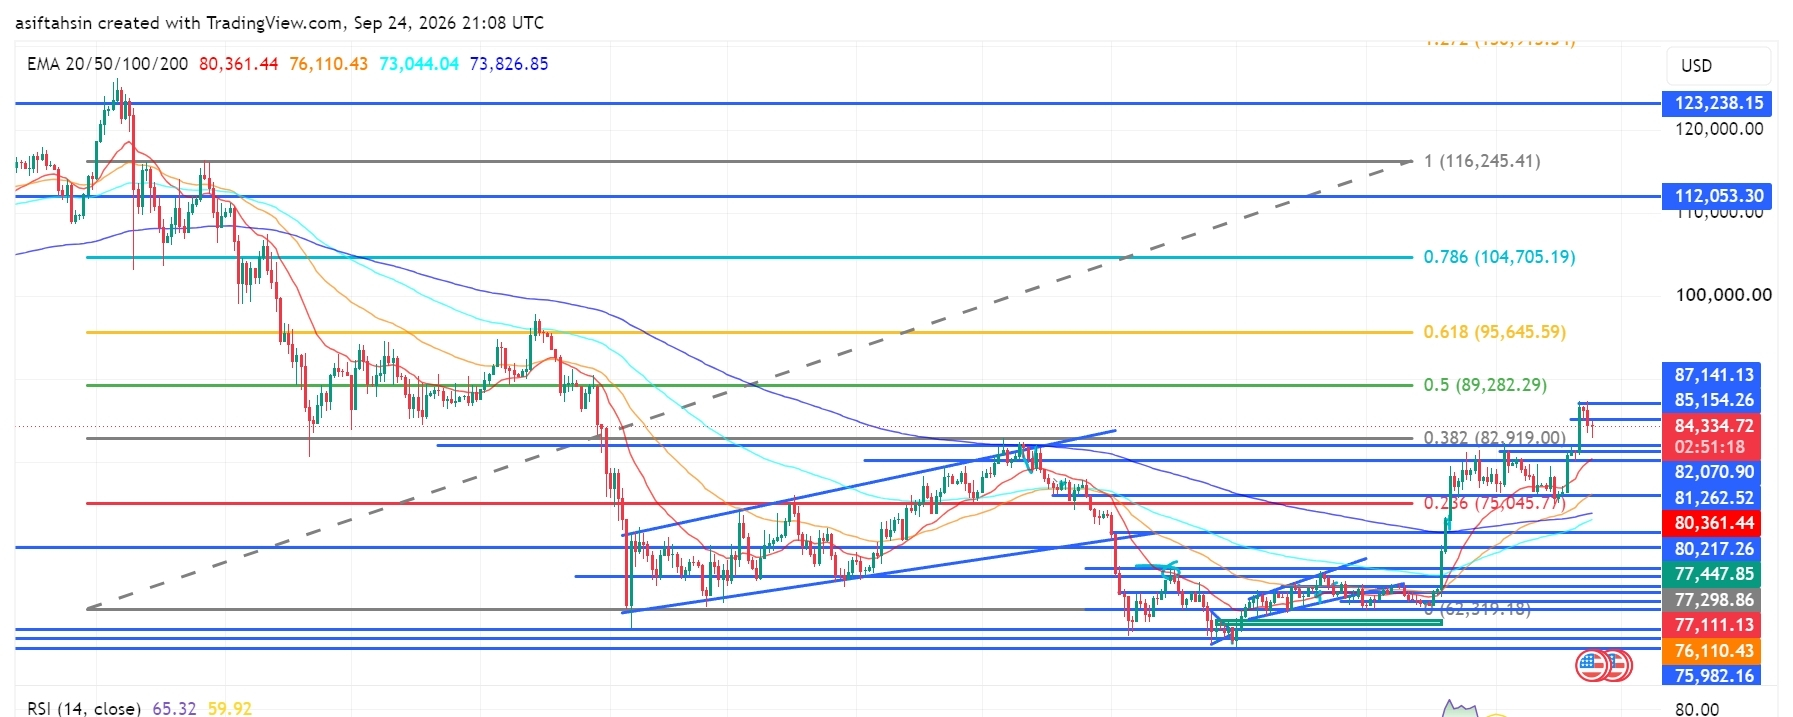

Bitcoin is trading around $84,334, holding above the recent breakout zone after recovering from the $75K–$77K area. The broader structure has improved significantly, with BTC now consolidating above the $82,919 Fibonacci level while remaining above all major EMAs.
📈 EMA Structure
20 EMA: $80,361
50 EMA: $76,110
100 EMA: $73,044
200 EMA: $73,827
BTC remains above all four major EMAs. The 20 EMA is also above the 50/100/200 EMAs, keeping the medium-term recovery structure constructive.
📐 Fibonacci Levels
0.236: $75,045.77
0.382: $82,919
0.5: $89,282.29
0.618: $95,645.59
0.786: $104,705.19
1.0: $116,245.41
The $82,919 level has become an important reference after the recent move above it. The next major Fibonacci areas are $89,282, $95,645, and $104,705.
🟢 Bullish Scenario
BTC is currently holding around $84.3K, above the $82,919 Fib level.
A sustained move higher could bring the following areas into focus:
$87,141
$89,282 — 0.5 Fib
$95,645 — 0.618 Fib
$104,705 — 0.786 Fib
$116,245 — 1.0 Fib
$123,238 — major chart resistance
The $87K–$89.3K region is the next major resistance area visible on the chart.
🔴 Pullback Scenario
Key nearby supports are:
$82,919
$82,070.90
$81,262.52
$80,359.51 — 20 EMA
$80,217.26
$77,447.85
$77,298.86
$77,111.13
$76,110.43 — 50 EMA
$75,982.16
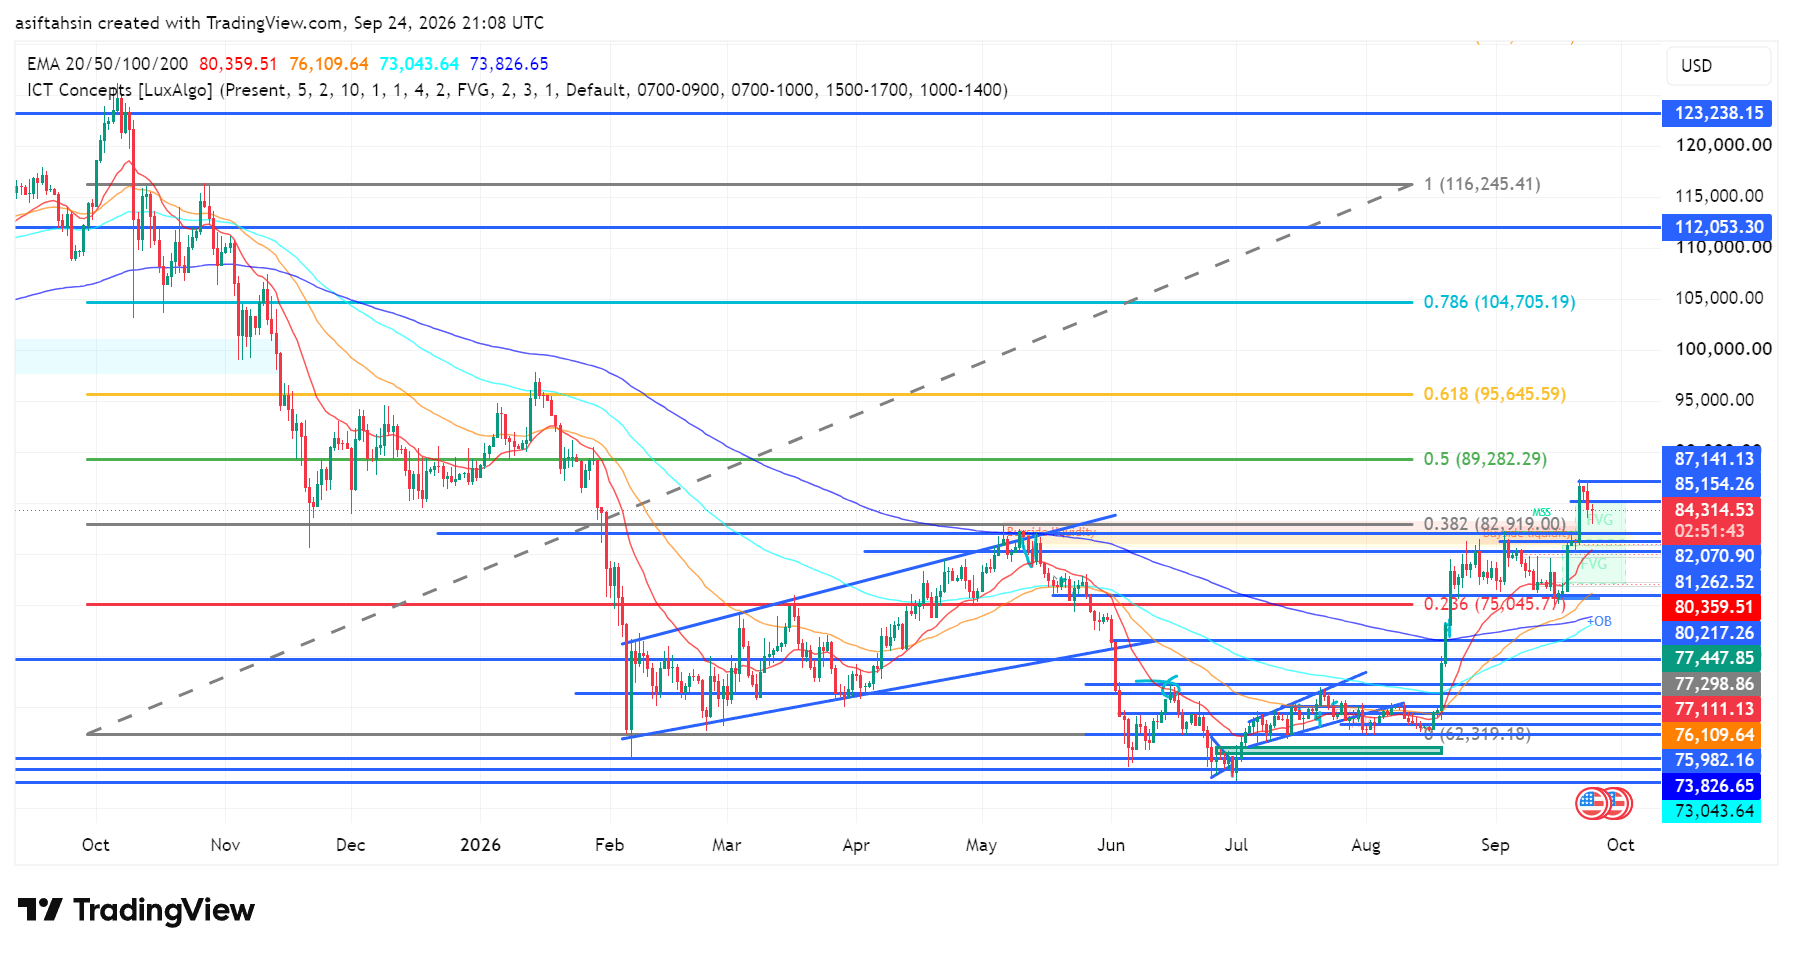
The $80.2K–$80.4K area is an important dynamic support zone, while $76K–$77.4K remains the broader recovery base.
🧠 Market Structure & Liquidity
BTC has developed a clear Recovery → Breakout → Retest → Consolidation → Continuation structure.
The market recovered from the $73K–$76K region, broke through the $82,919 resistance area, and is now consolidating around $84K.
The next major upside liquidity area is around $87K–$89K, followed by the $95,645 Fibonacci level.
📊 RSI Momentum
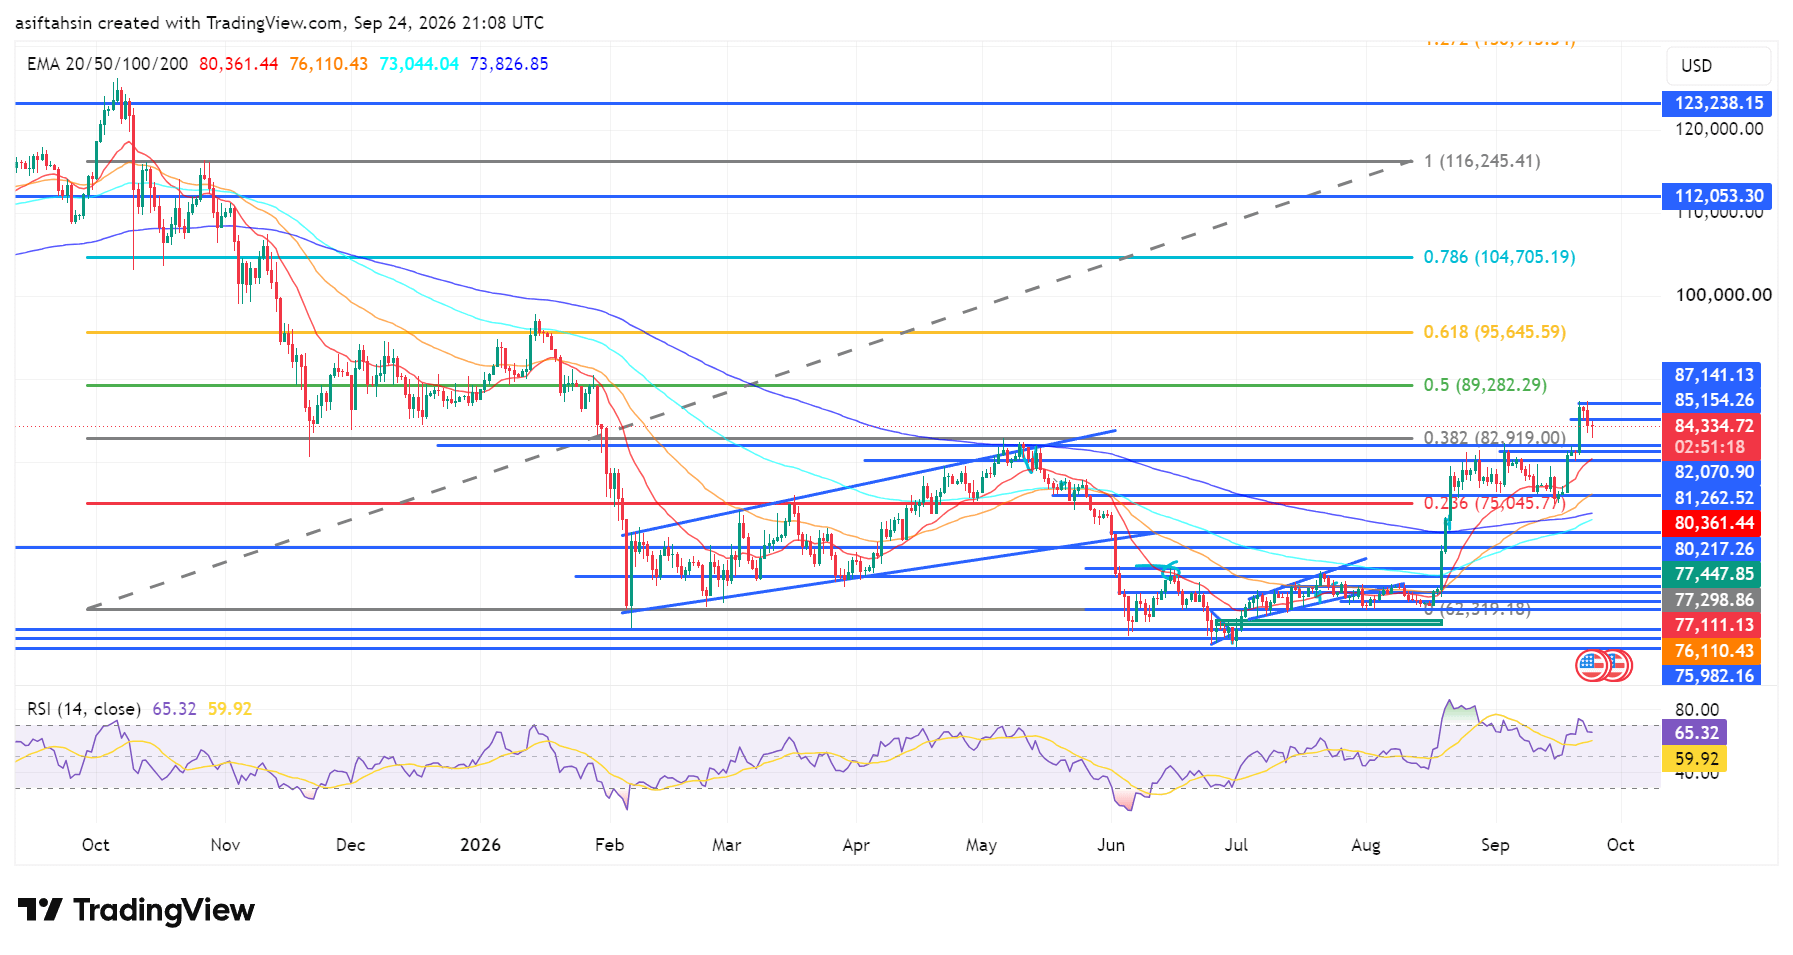
RSI: 65.32
Signal: 59.92
Momentum remains positive, with RSI above 60. It is approaching the 70 zone but has not reached an extreme reading on this chart.
🎯 Main Chart Levels
Resistance: $87,141 → $89,282 → $95,645 → $104,705
Support: $82,919 → $82,070 → $81,262 → $80,359 → $77,448
📌 Final Outlook
BTC's recovery structure remains constructive while price holds above the $80K–$82K region. The immediate chart focus is $82,919–$87,141. A sustained move above the upper range would bring $89,282 into focus, followed by $95,645.
