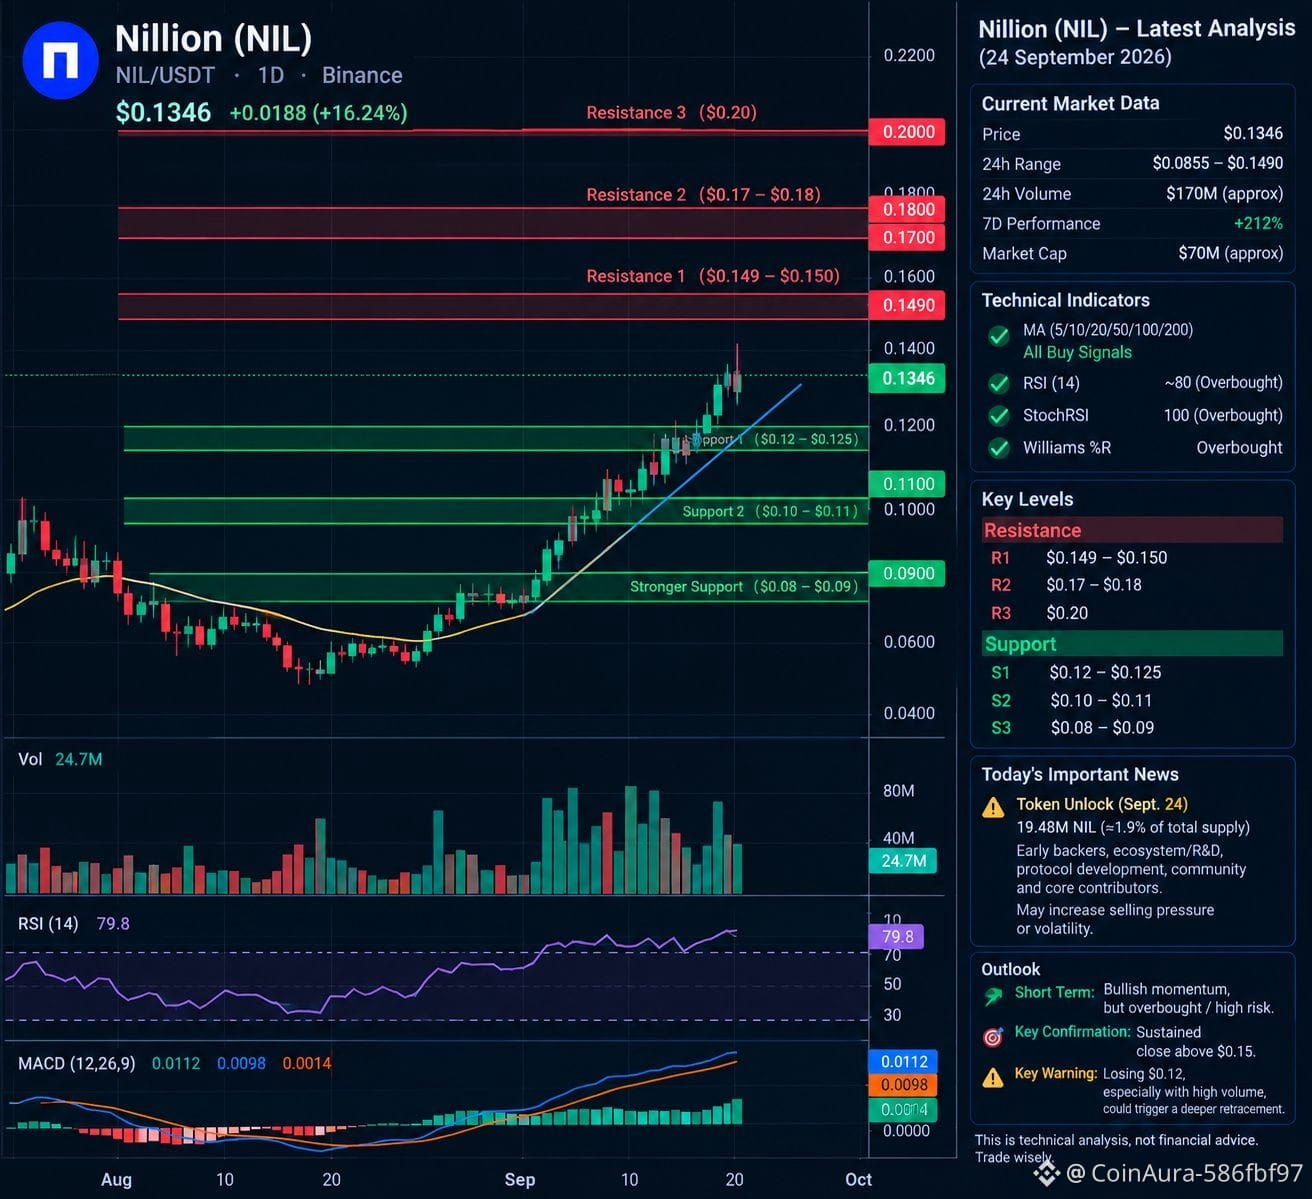
$NIL 📊 Nillion (NIL) — Latest Analysis for Today, 24 September 2026
Nillion is showing very strong short-term momentum, but the move is also highly extended.
💰 Current market picture
Price: around $0.13–$0.14
24h range: about $0.0855–$0.1490
24h volume: roughly $170M
7-day performance: about +212%
Market cap: around $70M �
Recent Binance daily data shows NIL rising from about $0.050 on Sept. 19 → $0.127 on Sept. 24, with very large volume. �
Investing.com
📈 Technical analysis
Trend: 🟢 Strong bullish momentum
Moving averages are currently bullish: the 5-, 10-, 20-, 50-, 100- and 200-period averages are all showing buy signals. �
Investing.com
However, RSI(14) is around 80, while StochRSI is 100 and Williams %R is in overbought territory. That means the rally is strong, but a sharp pullback or consolidation can happen. �
Investing.com
🎯 Important levels
Level
Area
🔴 Resistance 1
$0.149–$0.150
🔴 Resistance 2
$0.17–$0.18
🔴 Resistance 3
$0.20
🟢 Support 1
$0.12–$0.125
🟢 Support 2
$0.10–$0.11
🟢 Stronger support
$0.08–$0.09
Above $0.15: the chart could enter another momentum phase, with $0.17–$0.18 becoming an important area.#BinanceWillListHyperliquid(HYPE) #US30YearYieldHighestSince2004 #USWeighsPromotingDollarStablecoinsAbroad
Nillion is showing very strong short-term momentum, but the move is also highly extended.
💰 Current market picture
Price: around $0.13–$0.14
24h range: about $0.0855–$0.1490
24h volume: roughly $170M
7-day performance: about +212%
Market cap: around $70M �
Recent Binance daily data shows NIL rising from about $0.050 on Sept. 19 → $0.127 on Sept. 24, with very large volume. �
Investing.com
📈 Technical analysis
Trend: 🟢 Strong bullish momentum
Moving averages are currently bullish: the 5-, 10-, 20-, 50-, 100- and 200-period averages are all showing buy signals. �
Investing.com
However, RSI(14) is around 80, while StochRSI is 100 and Williams %R is in overbought territory. That means the rally is strong, but a sharp pullback or consolidation can happen. �
Investing.com
🎯 Important levels
Level
Area
🔴 Resistance 1
$0.149–$0.150
🔴 Resistance 2
$0.17–$0.18
🔴 Resistance 3
$0.20
🟢 Support 1
$0.12–$0.125
🟢 Support 2
$0.10–$0.11
🟢 Stronger support
$0.08–$0.09
Above $0.15: the chart could enter another momentum phase, with $0.17–$0.18 becoming an important area.#BinanceWillListHyperliquid(HYPE) #US30YearYieldHighestSince2004 #USWeighsPromotingDollarStablecoinsAbroad