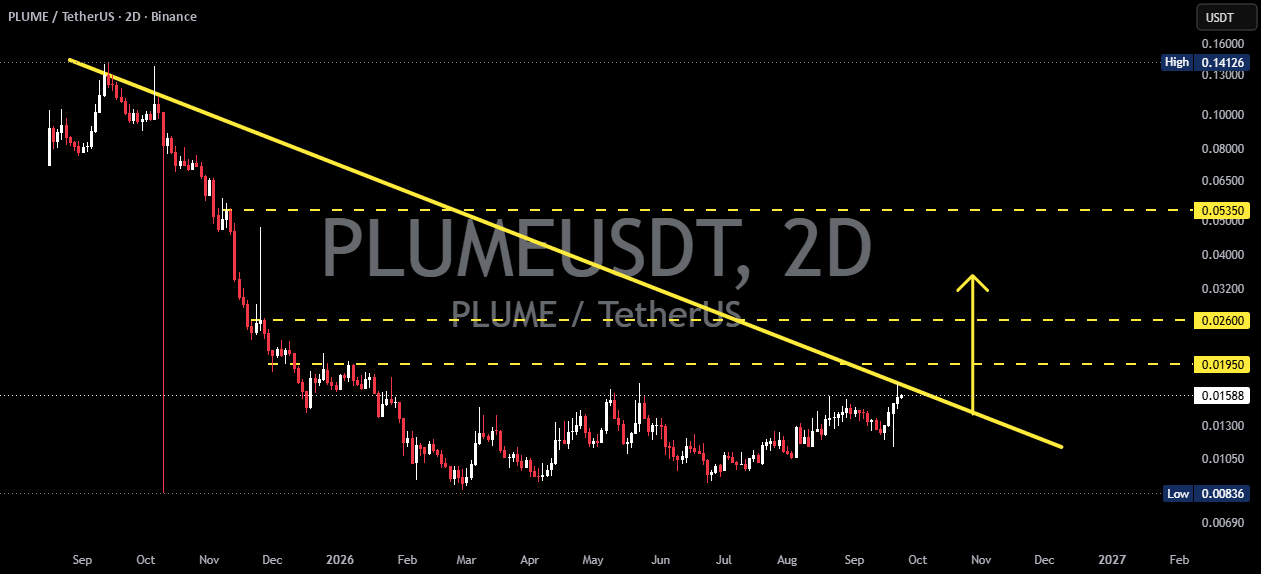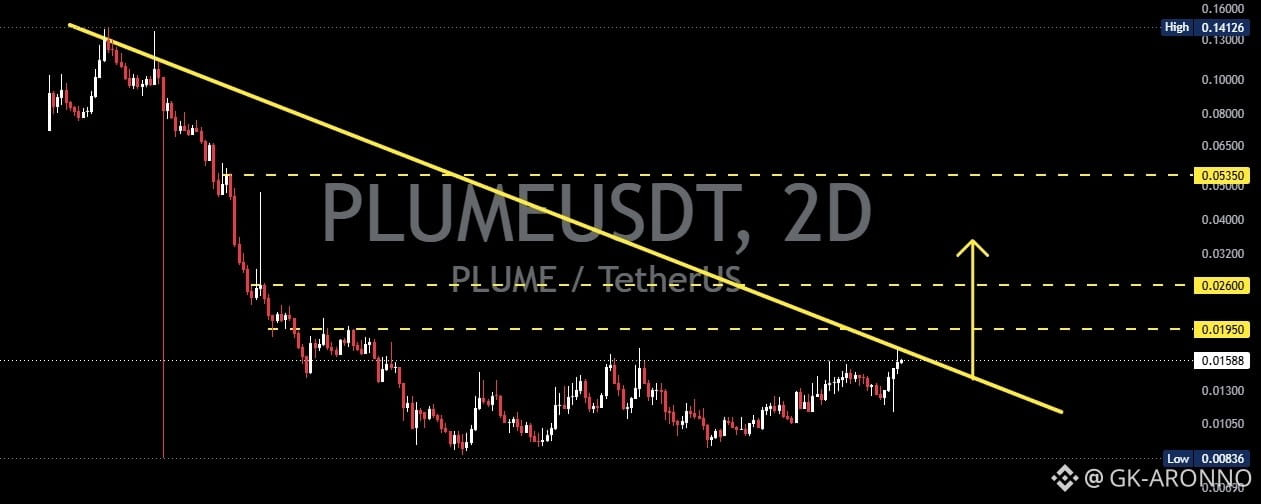

PLUME/USDT on the 2D (2-Day) timeframe appears to be trading below a Descending Trendline that has formed from the major high around $0.14126.
🔻 The Descending Trendline acts as a dynamic resistance, continuously putting pressure on price over time. As long as price has not successfully broken and held above this trendline, the medium-term bearish structure remains relevant.
📈 However, price is currently showing a recovery from the low around $0.00836 and is gradually moving upward toward the trendline resistance.
🔻 Descending Trendline Pattern
📉 A Descending Trendline forms when price creates a series of lower highs, with those highs connected to create a downward-sloping resistance line.
🔴 On this chart, the yellow line represents the dynamic resistance that has repeatedly limited PLUME's upside movement.
⚠️ As long as price remains below this trendline:
Resistance remains valid.
Bearish pressure has not been completely eliminated.
A breakout has not yet been confirmed.
🔥 On the other hand, a breakout followed by a 2D candle close above the trendline could indicate a potential shift toward a more bullish structure.
---
🟢 BULLISH SCENARIO
🚀 The bullish scenario becomes stronger if PLUME successfully breaks above the Descending Trendline and confirms the breakout.
🔑 Important levels to watch:
1️⃣ $0.01950
🟡 First horizontal resistance. Reclaiming this level could indicate that recovery momentum is strengthening.
2️⃣ $0.02600
🟡 The next major resistance and an important level for confirming continued bullish momentum.
3️⃣ $0.05350
🟡 A higher resistance target on the chart and an important area if the bullish breakout develops into a larger reversal.
📈 If the trendline breakout occurs with increasing volume and price manages to hold above the breakout area, the potential for a higher high becomes stronger.
---
🔴 BEARISH SCENARIO
⚠️ The bearish scenario remains valid as long as PLUME fails to break above the Descending Trendline.
🔻 If price gets rejected from the trendline and then loses nearby support, the current recovery could turn into a rejection.
📉 Repeated rejection from the trendline could maintain the lower-high structure.
🚨 If selling pressure strengthens, the next support areas to watch are:
🟢 $0.01300 – $0.01050
If this support zone fails to hold, the previous low around $0.00836 becomes the next important level on the chart.
---
🎯 KEY LEVELS
🔴 Major High: $0.14126
🟡 Resistance: $0.05350
🟡 Resistance: $0.02600
🟡 Resistance: $0.01950
⚪ Current Price: around $0.01592
🟢 Support Zone: $0.01300 – $0.01050
🟢 Major Low: $0.00836
---
⚡ CONCLUSION
📊 PLUME/USDT is currently in a recovery phase toward the Descending Trendline, making the trendline a very important area to watch.
🚀 Bullish: A breakout + confirmation above the Descending Trendline could open the way toward $0.01950 → $0.02600 → $0.05350.
🔴 Bearish: A rejection from the Descending Trendline could maintain the bearish structure and potentially lead to a retest of the lower support levels.
🎯 Key Point: Do not focus only on a wick breakout. A stronger confirmation would be a 2D candle closing above the trendline and holding above the breakout area afterward.