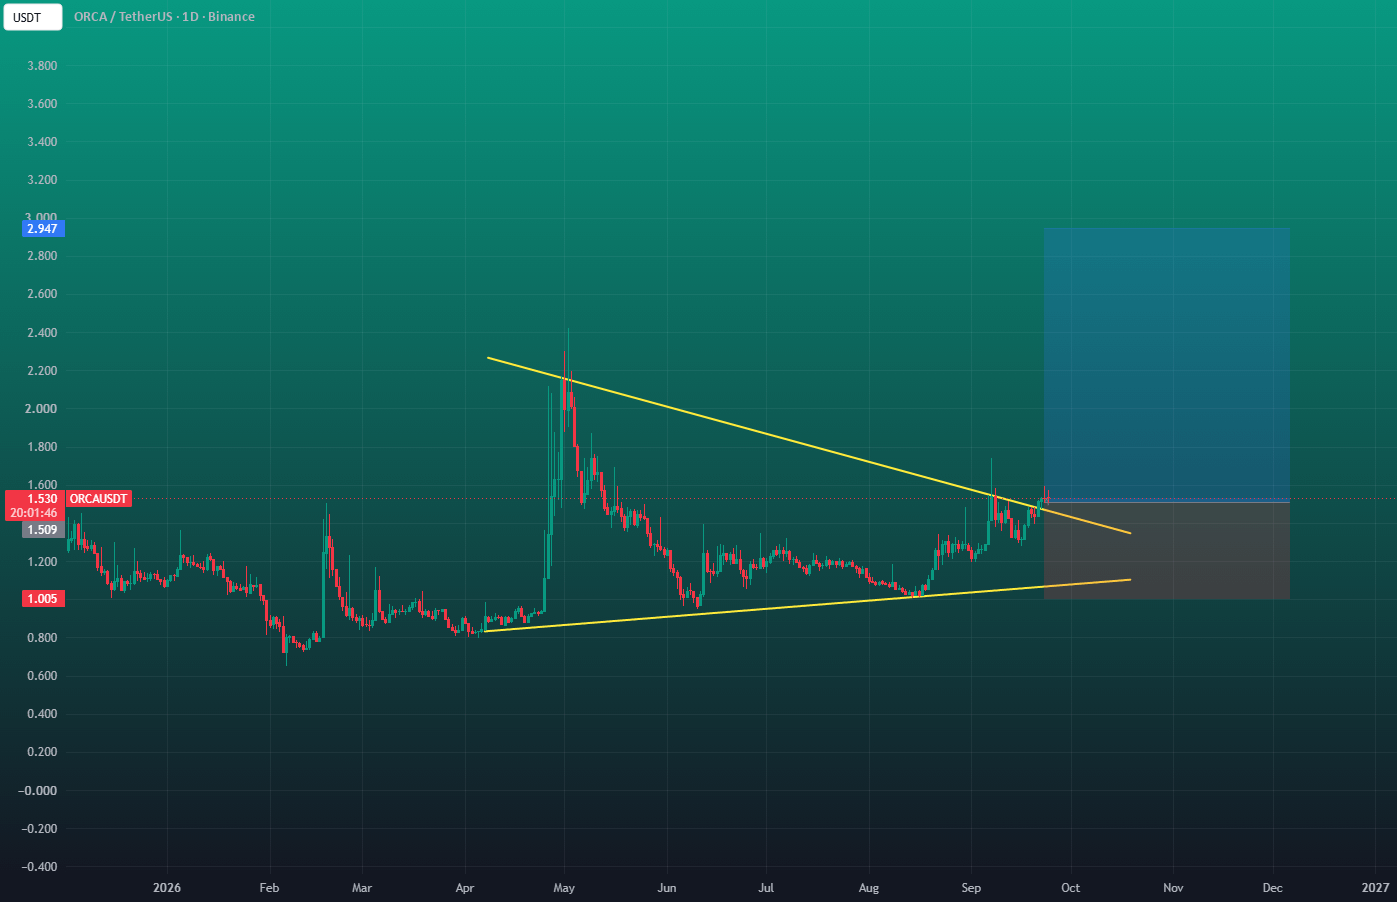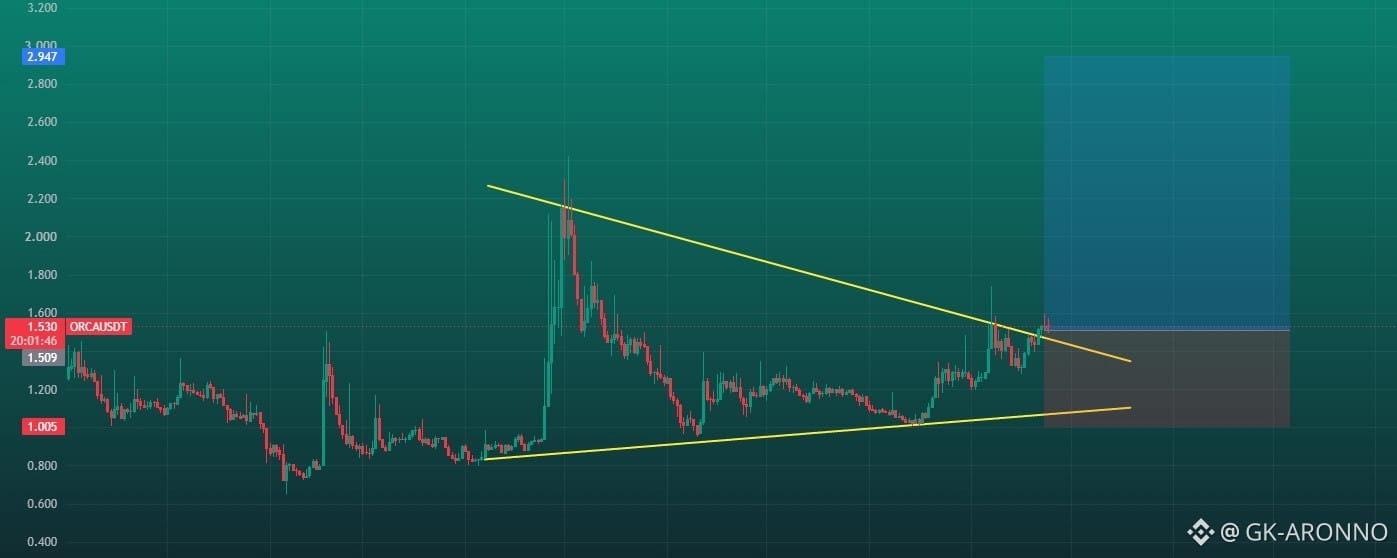

ORCA (Orca/USDT) has broken out of its symmetrical triangle pattern on the 1D chart! Price is currently holding above the upper resistance trendline, setting up a strong bullish setup.
A successful retest and bounce off this broken trendline support could trigger a solid rally toward higher targets over the coming weeks!
📊 Technical Snapshot:
💵 Coin: ORCA / USDT
⏳ Time Frame: 1D
🏦 Exchange: Binance
📍 Current Price: around 1.562
🟨 Major Support Zone: 1.005 – 0.850
📉 Nearest Resistance: 1.500 – 1.560
📈 Next Resistance Level / Long Target: 2.947
📐 Pattern & Technical Structure: Symmetrical Triangle Breakout
🔻 Descending Trendline
Price has been restricted by a clear descending trendline extending from the local peak near 2.270 (May 2026). This line serves as dynamic overhead resistance.
🔺 Ascending Support Trendline
Since early April, lower lows have been consistently bought up along a rising support trendline starting near the 0.850 region.
🔄 Symmetrical Triangle Compression
The converging upper descending resistance line and lower ascending support line form a large Symmetrical Triangle. Price action has compressed toward the apex around the 1.500 level, signaling an impending volatility expansion.
🚀 Breakout & Retest Confirmation
A daily candle close above the upper trendline (1.500–1.550) confirms the symmetrical triangle breakout. A successful retest of this trendline as new support could act as the launchpad for a sustained move upward.
🟢 Bullish Scenario
🚀 A daily candle close above the upper trendline (~1.500–1.550) confirms the symmetrical triangle breakout.
📈 If momentum holds and the current level acts as a reclaimed support, price could target higher resistance areas:
🎯 Target 1: 2.947 (Long Setup Target shown on chart)
💡 From the current level of 1.562, a move up to 2.947 represents a projected upside potential of +88%.
🔴 Bearish Scenario
⚠️ If ORCA fails to sustain the breakout and faces rejection, price could re-enter the consolidation range.
📉 A failure at this dynamic resistance risks a retracement back down toward the ascending support trendline around 1.005 – 0.900.
❌ Bullish Scenario Invalidation: A daily candle close below the major support zone at 1.005.
🎯 Conclusion
🔎 ORCA/USDT is attempting a major daily timeframe breakout out of a months-long Symmetrical Triangle structure.
🟢 Bullish: Confirmed daily close above the upper descending trendline → potential rally toward 2.947.
🔴 Bearish: Rejection at resistance → pullback toward lower ascending support zone near 1.005.
⚠️ Looking for daily candle confirmation and solid follow-through volume on the retest to avoid fake out risk.
⚠️ Disclaimer: Not Financial Advice (NFA). Always Do Your Own Research (DYOR) before taking any positions.
💬 Are you taking an entry on the retest or watchin