
📊 Technical Analysis — DOLO
⏱️ Time Frame: 2D
💱 Exchange: Binance
💰 Current Price: around $0.03050
---
🔎 Chart Structure
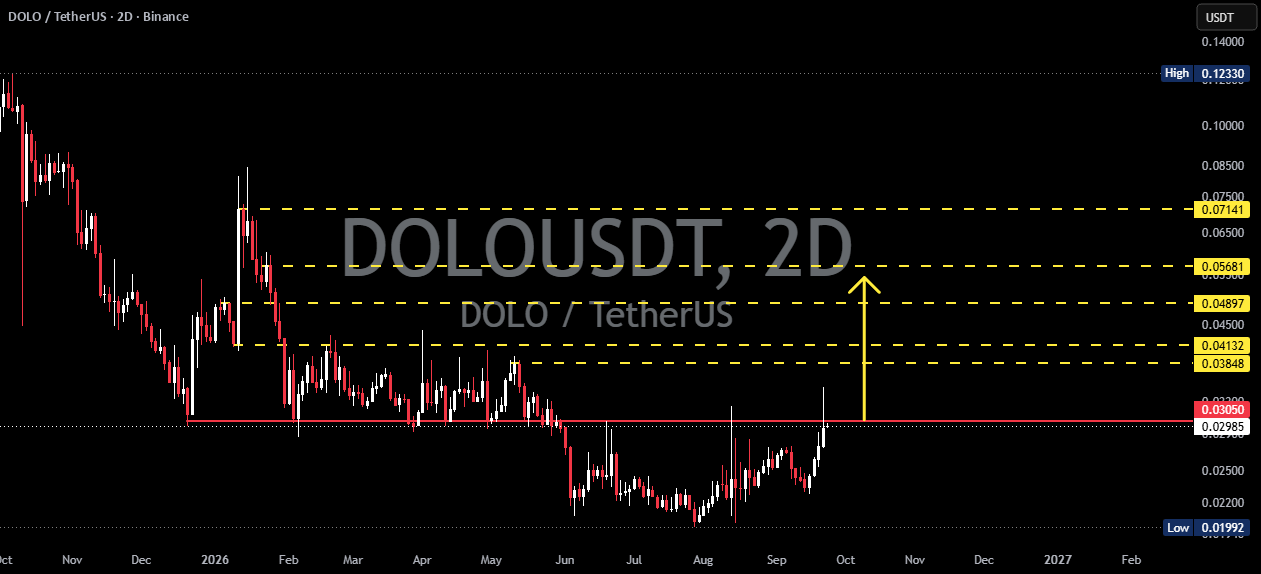
📉 DOLO/USDT previously experienced a prolonged downtrend, characterized by a series of lower highs and lower lows from the area around $0.12.
🔄 After reaching a low around $0.01992, the price began forming a recovery and consolidation phase.
🏗️ Over the past several months, the price has been moving within a range, with strong support around the $0.022–$0.030 area.
🔥 The price is currently approaching and testing the key horizontal resistance around $0.03050.
📈 If this level is successfully broken and held as support, the price structure could become more constructive and open the way toward the next resistance levels.
---
📐 Pattern / Structure
🟡 Horizontal Resistance / Breakout Level:
$0.03050
➡️ This is an important level because the price has previously experienced multiple rejections around this area.
🟢 Major Support:
$0.01992 – $0.02200
➡️ This area represents the lower part of the structure and is an important defensive zone if selling pressure returns.
🔄 Overall, the chart shows a base-building / accumulation-like consolidation phase following the prolonged decline.
⚠️ However, breakout confirmation is still required because the price remains around the key resistance zone.
---
🟢 BULLISH SCENARIO
🚀 If DOLO successfully breaks out and closes strongly above $0.03050, this resistance could potentially turn into support.
📈 Stronger confirmation could occur if the price retests $0.03050 and successfully holds above it.
🎯 Potential Resistance Targets:
1️⃣ $0.03848 — First Resistance
2️⃣ $0.04132 — Second Resistance
3️⃣ $0.04897 — Major Resistance
4️⃣ $0.05681 — Higher Resistance
5️⃣ $0.07141 — Major Target / Previous Supply Area
🔥 If breakout momentum strengthens, the $0.04897–$0.05681 zone becomes an important area to watch, as it could potentially attract profit-taking or rejection.
🚀 A further breakout above this zone toward $0.07141 would bring the price back into a significantly higher resistance area from the previous structure.
---
🔴 BEARISH SCENARIO
⚠️ If DOLO fails to maintain momentum and gets rejected from $0.03050, the breakout should be considered unconfirmed.
📉 The price could potentially return to the previous range.
🔻 If selling pressure increases, attention can be focused on:
🟡 $0.02900–$0.03050 → Breakout / Retest Area
🟠 $0.02500–$0.02700 → Intermediate Support
🔴 $0.02200 → Major Support
⛔ $0.01992 → Major Swing Low
💥 If $0.01992 is broken with significant selling pressure, the current recovery structure could become invalidated, increasing the risk of further downside.
---
🎯 KEY LEVELS TO WATCH
Level Function
🟢 $0.07141 Major Resistance
🟢 $0.05681 Higher Resistance
🟢 $0.04897 Major Resistance
🟡 $0.04132 Resistance
🟡 $0.03848 First Resistance
🔥 $0.03050 Breakout / Key Resistance
🟠 $0.02200 Major Support
🔴 $0.01992 Major Swing Low
---
🧠 Conclusion
🔥 DOLO/USDT is currently at a very important area around $0.03050.
📈 Bullish: Breakout and close above $0.03050 → successful retest → potential movement toward $0.03848 → $0.04132 → $0.04897 → $0.05681 → $0.07141.
📉 Bearish: Rejection from $0.03050 → price returns into the range → $0.02200–$0.01992 becomes an important support zone to monitor.
⚠️ Note: The levels above are technical areas identified from the chart and do not guarantee that price will reach any target. Candle closes, volume, and retests can help assess the validity of a breakout.