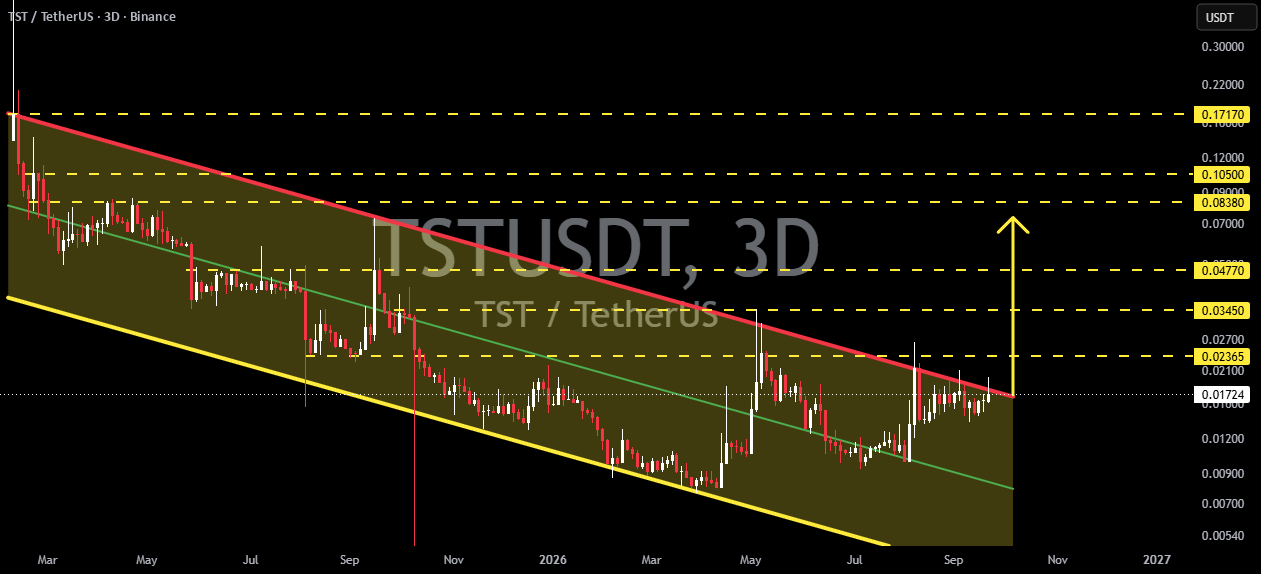

🔹 TST/USDT on the 3D (3-Day) timeframe appears to be moving within a long-standing Descending Channel pattern.
📉 A Descending Channel is formed by two parallel trendlines that both slope downward:
🔴 Upper Trendline → acts as dynamic resistance.
🟡 Lower Trendline → acts as dynamic support.
🟢 Middle Trendline → represents the equilibrium area within the channel.
🔥 The current price is around $0.01728 and is approaching the upper resistance / upper boundary of the Descending Channel. This is a critical area because a confirmed breakout could signal a potential shift from the previous bearish structure toward a new bullish phase.
---
🔍 Descending Channel Characteristics
📉 As long as price remains inside the channel, the overall structure continues to show lower highs and lower lows, meaning bearish pressure has not been completely eliminated.
🔴 Upper Channel Resistance
→ The red trendline represents the primary dynamic resistance. Price has previously faced selling pressure when approaching this area.
🟡 Lower Channel Support
→ The yellow trendline represents the dynamic support. The lower area of the channel has previously acted as a zone where price experienced rebounds.
🟢 Channel Midline
→ The green trendline can be used to evaluate momentum. Price movement above or below this line can help identify changes in medium-term strength.
---
🟢 Bullish Scenario — Channel Breakout
🚀 The bullish scenario becomes stronger if TST breaks above the upper trendline of the Descending Channel and achieves a confirmed 3D candle close above it.
📈 A breakout accompanied by strong volume and follow-through could indicate that price is beginning to exit the previous bearish structure.
🎯 Potential resistance/target levels based on the chart:
1. 🎯 $0.02365 — First resistance after the breakout
2. 🎯 $0.03450 — Next resistance
3. 🎯 $0.04770 — Major resistance
4. 🎯 $0.09830 — Higher resistance
5. 🎯 $0.10500 — Major resistance
6. 🚀 $0.17170 — Long-term upper target/resistance
🔥 The stronger price holds above the upper channel, the greater the potential for an expansion toward the next resistance levels.
⚠️ The breakout should preferably be confirmed by a candle close, because a wick that only temporarily moves above the channel does not necessarily represent a valid breakout.
---
🔴 Bearish Scenario — Rejection from the Upper Channel
⚠️ If TST fails to break through the upper trendline and encounters renewed selling pressure, price could continue moving within the Descending Channel.
📉 A rejection from the resistance area could potentially send price back toward:
🔻 $0.01728 → Current price area
🔻 $0.01200–$0.00900 → Historical support area visible on the chart
🔻 Lower Channel Support → Major dynamic support of the channel
💥 If the lower channel is eventually broken to the downside with confirmation, the bearish structure could regain momentum and potentially lead to the formation of a new lower low.
---
🧩 Pattern Summary
📐 Pattern: Descending Channel
📊 Timeframe: 3D
💵 Current Price: Around $0.01728
🔴 Major Resistance: Upper Descending Channel
🟢 Dynamic Support: Lower Descending Channel
🟡 Breakout Trigger: Strong close above the upper channel
🔻 Bullish Invalidation: Strong rejection followed by a return inside the channel
🔥 The current area is particularly important because price is approaching the upper boundary of the Descending Channel.
🚀 Breakout + Confirmation → Opens the path toward $0.02365 → $0.03450 → $0.04770 and potentially higher resistance levels.
📉 Rejection → The Descending Channel remains valid, and price could potentially move back toward the lower channel support.