



Professional Diversity Network (IPDN) is experiencing one of its sharpest moves in recent memory. The daily chart shows a stock detached from its own trend structure. Price sits far above every major moving average, with momentum readings at levels rarely seen outside speculative squeezes.
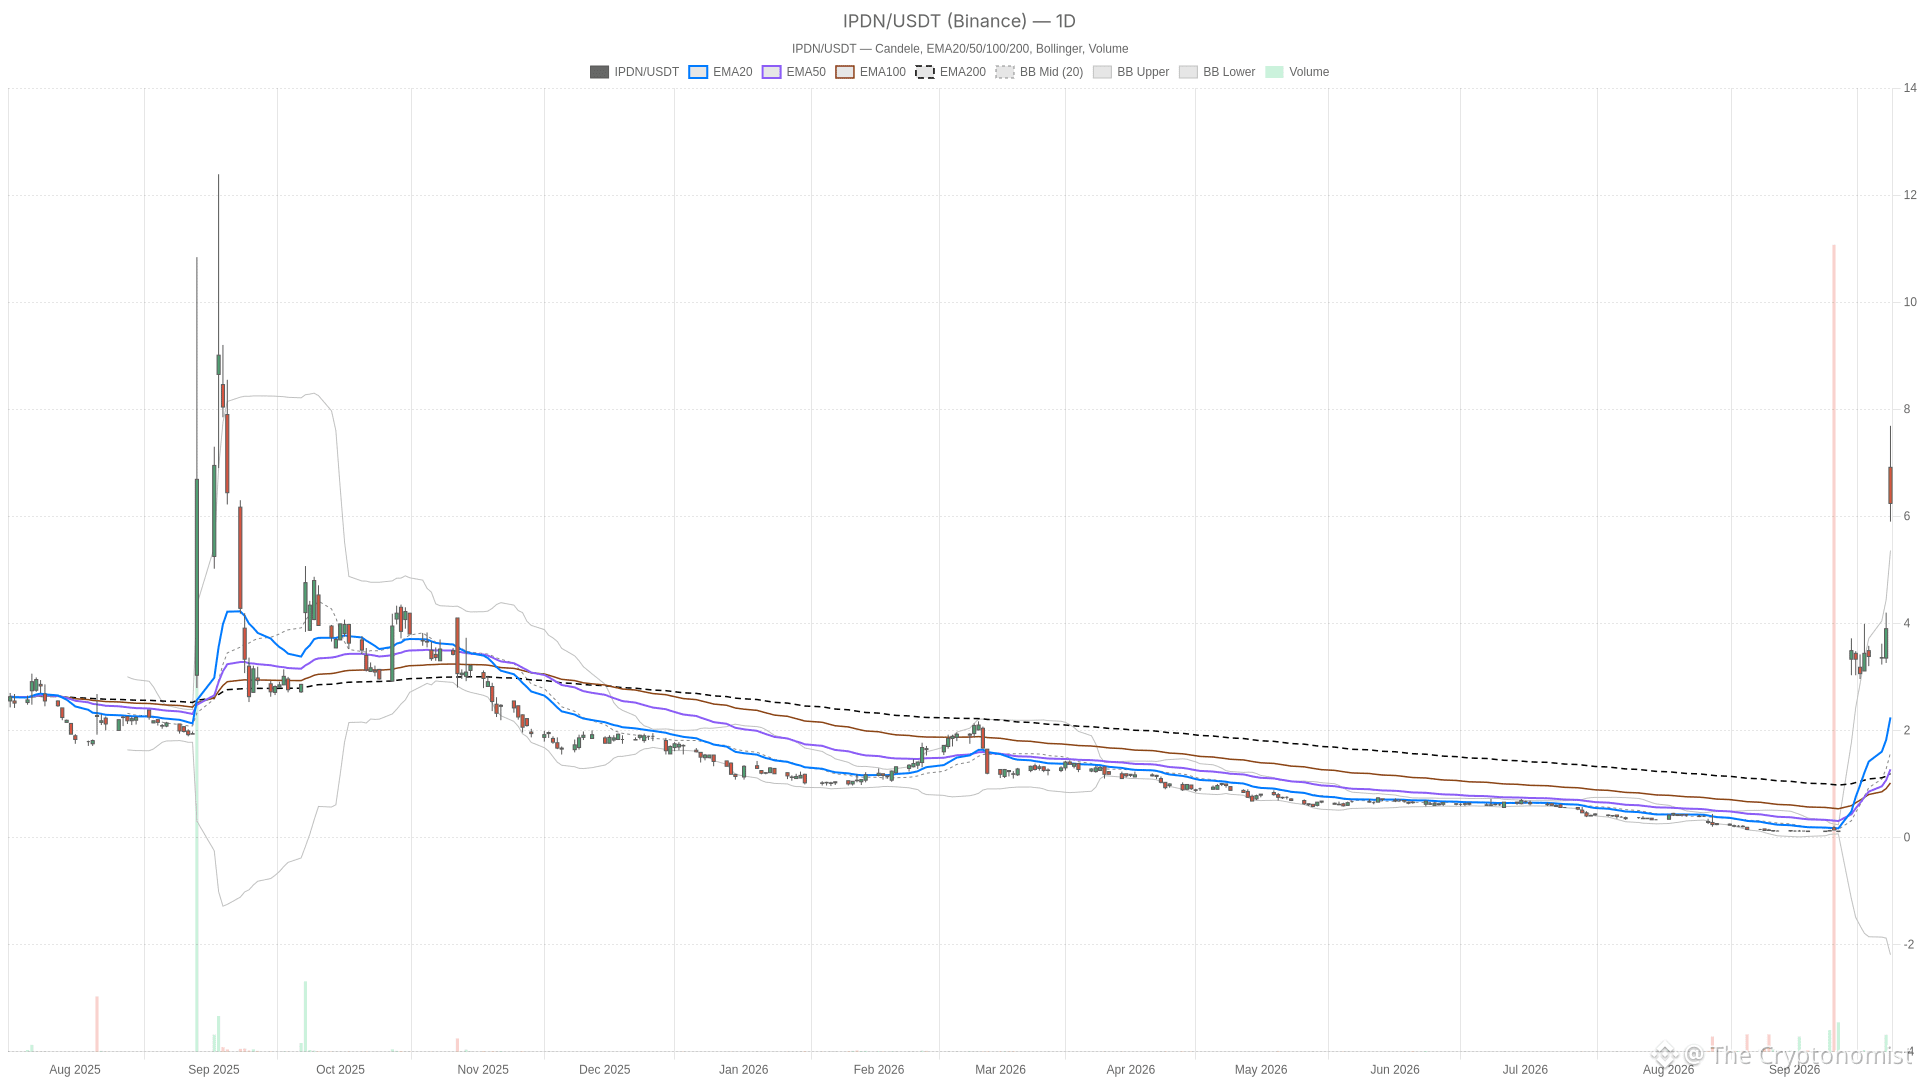 IPDN — daily chart with candlesticks, EMA20/EMA50 and volume.
Key takeaways
IPDN closed at $6.24 after spiking to an intraday high of $7.69 and sliding to a $5.90 low.
Daily RSI14 reached 92.19, an extreme reading historically linked to instability rather than sustainability.
Price now trades roughly five times above the daily EMA200, which sits at just $1.19.
MACD remains bullish across all three timeframes, keeping the trend-following case intact.
The next session’s pivot sits at $6.61, with resistance at $7.32 and support at $5.53.
Daily Bias — Why the Bullish Regime Carries Cautionary Signals
The daily trend for Professional Diversity Network remains technically bullish, but the candle structure warns that this move has become dangerously stretched. IPDN closed at 6.24 after opening at 6.92 and spiking to an intraday high of 7.69. However, price then slid back to test the 5.90 low before settling near the bottom of the range. A wide-range session that reverses from the highs and closes near the lows is not a classic continuation signature. It looks more like a stock that ran too far, too fast, attracting heavy profit-taking into strength.
Notably, the moving average picture reinforces just how extended this Professional Diversity Network move has become. The daily EMA20 sits at 2.24, the EMA50 at 1.27, and the EMA200 at just 1.19. Price is now trading roughly five times above its own 200-day average. That is not a normal trending environment. It is the signature of a violent, low-base breakout where the averages simply have not had time to catch up.
Meanwhile, RSI14 on the daily chart sits at 92.19. That is about as extreme as the indicator gets. Historically, these readings are unstable rather than sustainable. Momentum in the strict sense remains bullish. The MACD line reads 1.12 against a signal line of 0.65, producing a positive histogram of 0.47. In other words, the trend-following math still favors buyers. The conflict is that a 92 RSI paired with a reversal-style daily candle usually precedes a cooling-off period, not immediate further acceleration.
Bollinger Bands add another layer to this picture. The daily mid-band is at 1.58, with the upper band at 5.36. Yet the close of 6.24 sits above that upper boundary. Price trading beyond the upper band on a stock this stretched typically reflects a volatility event rather than a stable uptrend. Additionally, ATR14 is 0.79, but the actual range was close to 1.79 points — more than double the average. That gap between typical and realized volatility confirms this is an outlier session, not routine price action.
Meanwhile, daily pivot levels are also informative. The pivot point sits at 6.61, with resistance at 7.32 and support at 5.53. The close at 6.24 is below the pivot, meaning sellers reclaimed the intraday balance point after the early spike. That is a subtle but meaningful detail for anyone tracking Professional Diversity Network price action into the next session.
1H Timeframe — Confirming Strength Without Confirming Stability
The hourly chart confirms that Professional Diversity Network’s bullish momentum persists, but it does not confirm that the move is stable or sustainable. The 1H chart shows IPDN closing at 6.30, with RSI14 at 90.82, still deeply overbought. MACD remains constructive. The line is at 0.52 above the signal at 0.25, and the histogram reads 0.28. The regime is again labeled bullish, and on a pure momentum basis that holds.
At the same time, price is trading in a very tight band. The H1 pivot sits at 6.32, resistance at 6.36, and support at 6.26. That tightness suggests consolidation after the volatility spike rather than a fresh leg higher. It is a meaningful nuance for Professional Diversity Network stock watchers, since it shows short-term equilibrium building right at a key intraday level.
Notably, the EMA structure on the hourly chart mirrors the daily distortion. EMA20 sits at 3.96, EMA50 at 3.20, and EMA200 at 1.52, all well below current price. This confirms the daily read: the move has been fast enough that intermediate averages are lagging badly. In contrast to the daily candle’s clear rejection from highs, the hourly chart shows a market that has stabilized just above 6.30, neither pushing decisively higher nor breaking down.
15-Minute Execution Context — Where the Tight Range Defines the Setup
The 15-minute chart offers the most actionable context for Professional Diversity Network traders by defining a tight range that will determine the next directional move. On this timeframe, RSI14 reads 88.57, still extreme but marginally cooler than the higher timeframes. MACD histogram sits at 0.31, slightly firmer than the hourly reading. This hints that very short-term momentum has not fully faded.
Therefore, for anyone looking at Professional Diversity Network technical analysis for entry timing, this tight range is the actionable zone. Price is boxed between the same pivot cluster seen on the hourly chart. Pivot is at 6.32, resistance at 6.36, and support at 6.26. A clean break above 6.36 would open room back toward the daily pivot at 6.61. Meanwhile, a slip below 6.26 would test whether the broader uptrend can hold.
Bullish Scenario — What Keeps the Rally Alive
The bullish case for Professional Diversity Network rests on MACD momentum remaining positive across all three timeframes. If IPDN can reclaim the daily pivot at 6.61 and push through resistance at 7.32, that would suggest the underlying demand behind this spike still has room to run. Sustained volume alongside a reclaim of the intraday highs would be the clearest evidence. It would signal a genuine continuation rather than a blow-off top.
Bearish Scenario — Why Mean-Reversion Risk Cannot Be Ignored
The bearish case for Professional Diversity Network is built squarely on mean-reversion risk. With price trading roughly five times above the daily EMA200, an RSI near 92, and a daily candle that reversed sharply from 7.69 down to a 6.24 close, the setup has the hallmarks of exhaustion. A break below the daily support at 5.53 would invalidate the near-term bullish continuation thesis. Similarly, a failure to hold the hourly support at 6.26 would point toward a deeper corrective pullback toward the still-distant EMA levels.
Closing Take — A Market at a Genuine Crossroads
Overall, Professional Diversity Network sits at a genuine crossroads. The daily regime is technically bullish, and MACD momentum remains positive across timeframes. However, the extreme RSI readings, the reversal-style daily candle, and the enormous gap between price and the longer-term EMAs all point to a market that is stretched. Volatility, as shown by the ATR figures, is running well above normal. That alone argues for caution around position sizing. Given the disconnect between short-term strength and longer-term overextension, uncertainty around the next move in Professional Diversity Network shares remains unusually high. Traders should treat both the bullish and bearish scenarios as live possibilities rather than a settled outcome.
FAQ
What is driving the extreme overbought readings on IPDN stock?
The Professional Diversity Network rally has been so fast and violent that momentum indicators have spiked to extreme levels. Daily RSI14 hit 92.19, reflecting a parabolic move where price detached from its moving averages. The stock now trades roughly five times above its 200-day EMA of $1.19, confirming this is a volatility event rather than a normal trending environment.
What are the key support and resistance levels for IPDN?
The daily pivot sits at $6.61, with resistance at $7.32 and support at $5.53. On the hourly and 15-minute charts, a tight range has formed around the pivot at $6.32, with resistance at $6.36 and support at $6.26. A break above $6.36 opens room toward $6.61, while a slip below $6.26 tests the broader uptrend.
Is the IPDN rally sustainable given current conditions?
MACD momentum remains bullish across daily, hourly, and 15-minute timeframes, which supports further upside in theory. However, the reversal-style daily candle, the 92 RSI, and the enormous gap to longer-term EMAs all signal a stretched market. Both the bullish continuation and the bearish mean-reversion scenarios remain live possibilities, and traders should treat either outcome as plausible.
Disclaimer: This article is for informational purposes only and does not constitute financial advice, an investment recommendation, or a solicitation to buy or sell any financial instrument or cryptocurrency. The analysis provided is not indicative of future results. Investing in crypto assets and financial markets carries a high risk of capital loss. Always do your own research (DYOR) and consult a qualified financial advisor before making any decision.
Article produced with the assistance of artificial intelligence and reviewed by the editorial team.