
💵 Coin: OPG
⌛ Time Frame: 1D
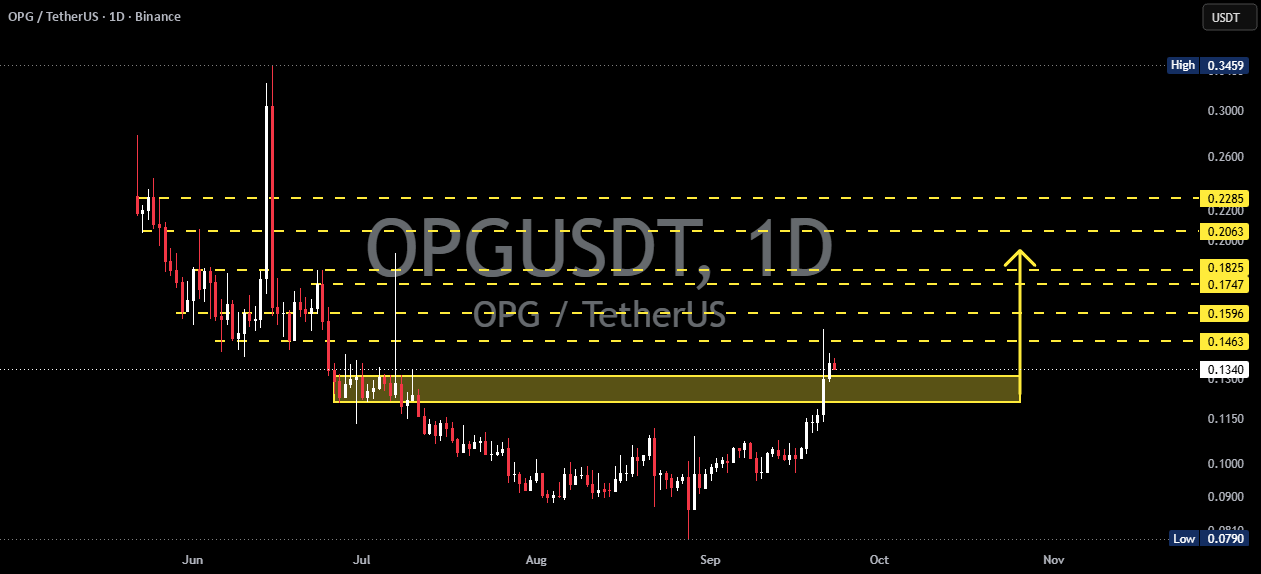
📍 Accumulation / Support Zone: $0.121 – $0.131
📌 Current Area: around $0.134
---
🟨 🔍 PATTERN & MARKET STRUCTURE
The chart shows a prolonged accumulation/base formation after OPG experienced a significant decline from higher levels.
🔸 The $0.121 – $0.131 area represents an important zone where price previously consolidated and found support.
🔸 After forming a base, OPG began to recover and subsequently broke above the $0.121–$0.131 zone.
🔸 The latest price action shows increasing bullish momentum, with the daily candle moving back above $0.131.
🔸 From a technical perspective, the previous resistance area may potentially become support if price manages to hold above it.
📌 Therefore, the structure is better described as accumulation/base → breakout → potential retest, rather than considering it a fully confirmed classical pattern.
---
🟢 📈 BULLISH SCENARIO
If OPG manages to maintain price above $0.131 and the breakout receives confirmation from the daily candle, bullish momentum could continue toward the next resistance levels.
🎯 Resistance Targets:
1. 🥇 $0.1463
2. 🥈 $0.1596
3. 🥉 $0.1747
4. 🚀 $0.1825
5. 🔥 $0.2063
6. 🚀 $0.2285
📈 If bullish momentum strengthens, the $0.1825–$0.2063 area could become an important resistance zone.
🔥 If price successfully breaks above $0.2063, the next major area to watch would be around $0.2285.
---
🔄 🟨 POTENTIAL RETEST
After a breakout, price does not always move higher immediately.
🔄 OPG could potentially perform a retest of the previous breakout zone.
📍 $0.131 → Important breakout/support flip level
📍 $0.121 → Lower boundary of the accumulation zone
If price pulls back but manages to hold above $0.131, the bullish structure could remain intact.
---
🔴 📉 BEARISH SCENARIO
⚠️ The bullish scenario needs to be watched carefully if the breakout fails to hold.
If price falls back below $0.131, the breakout could develop into a false breakout.
🔻 If selling pressure continues and price loses $0.121, OPG could potentially return to the previous bearish structure and search for lower support levels.
📉 Losing the entire $0.121–$0.131 zone would significantly weaken the breakout thesis and increase the possibility of further downside.
---
🧠 🔑 KEY LEVELS
🟨 $0.121 – $0.131 → Accumulation / Support Zone
🟢 $0.131 → Breakout & potential support
⚪ $0.1463 → Resistance 1
⚪ $0.1596 → Resistance 2
⚪ $0.1747 → Resistance 3
⚪ $0.1825 → Major Resistance
⚪ $0.2063 → Higher Resistance
🟡 $0.2285 → Major Upside Resistance
---
📌 CONCLUSION
🚀 OPG is showing a recovery structure following a prolonged period of consolidation.
🟨 The $0.121–$0.131 zone is the most important area on this chart.
📈 As long as price manages to hold this zone after the breakout, the bullish structure could potentially develop toward $0.1463 → $0.1596 → $0.1747 → $0.1825, with higher resistance levels at $0.2063 and $0.2285.
⚠️ On the other hand, a return below $0.131 should be monitored as a sign that the breakout is losing strength. A loss of $0.121 would represent a more significant invalidation of the current breakout structure.