$KERNEL
KERNEL/USDT — Momentum Ignition After Range Breakout ◆━━━━━━━━━━━━━━━━━━━━━━━━━━━━━━━━◆
✔︎ Market Overview
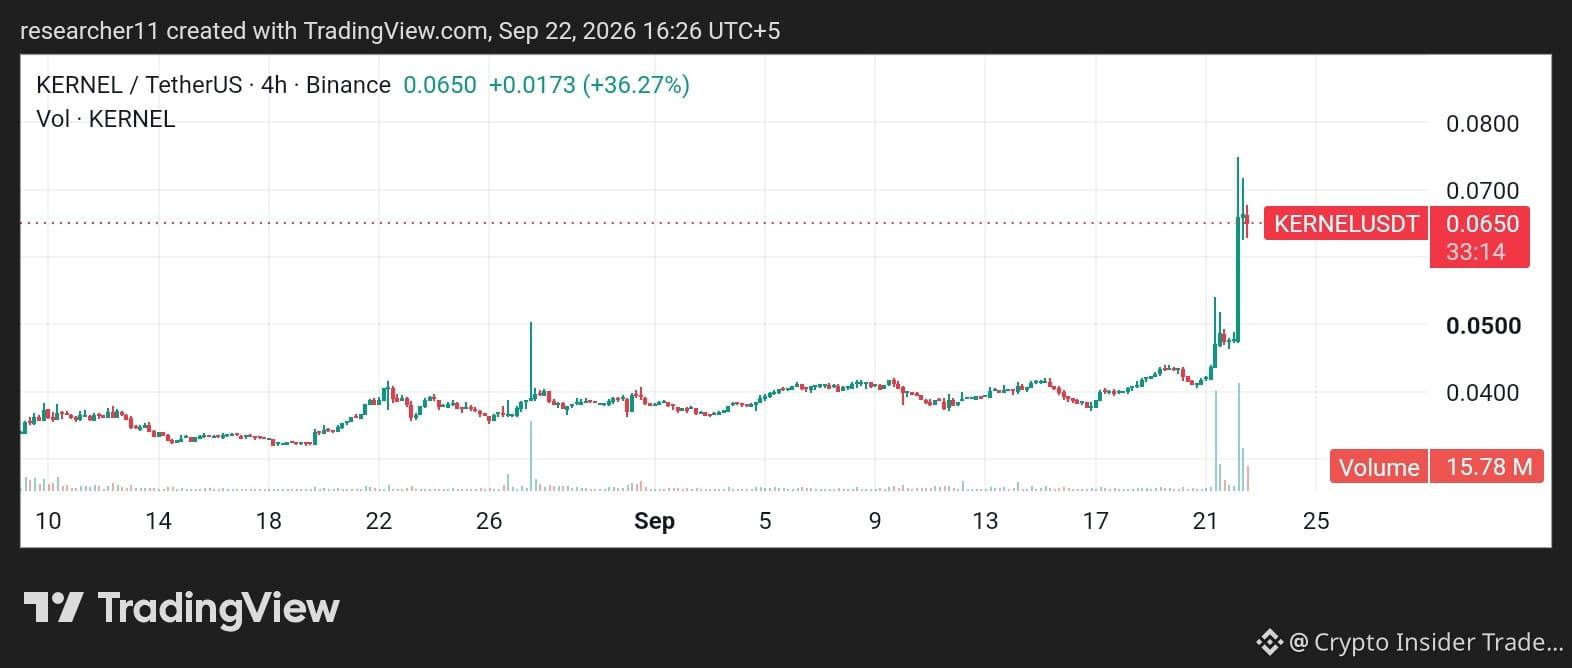
KERNELUSDT surged +36.27% on the 4H chart, reaching 0.0650 after breaking free from a multi-week trading range between 0.035–0.045.
✔︎ Price expansion caught many traders by surprise.
✔︎ Volume climbed to 15.78M, supporting the breakout.
✔︎ Market sentiment has shifted from accumulation to expansion.
◆━━━━━━━━━━━━━━━━━━━━━━━━━━━━━━━━◆
➤ Technical Analysis
① Trend: Bullish transition from prolonged sideways movement.
② Structure: Breakout above key resistance at 0.045.
③ Volume: Elevated participation confirms interest from buyers.
④ Momentum: Strong upward acceleration visible on the chart.
⑤ RSI: Extended conditions may lead to short-term cooling.
◆━━━━━━━━━━━━━━━━━━━━━━━━━━━━━━━━◆
➤ Scenario Analysis
🟢 Bullish: Holding above 0.050 could strengthen the breakout and support continuation higher.
🔴 Bearish: Falling back below 0.045 would weaken the bullish structure and increase retracement risk.
⚪ Neutral: Price forms a new base above previous resistance before another move.
◆━━━━━━━━━━━━━━━━━━━━━━━━━━━━━━━━◆
➤ Key Levels
✔︎ Resistance: 0.070 | 0.080
✔︎ Support: 0.045 | 0.038
◆━━━━━━━━━━━━━━━━━━━━━━━━━━━━━━━━◆
➜ Bottom Line
The breakout looks technically healthy, but the next few candles will determine whether KERNEL can convert former resistance into reliable support.
#kernel
KERNEL/USDT — Momentum Ignition After Range Breakout ◆━━━━━━━━━━━━━━━━━━━━━━━━━━━━━━━━◆
✔︎ Market Overview
KERNELUSDT surged +36.27% on the 4H chart, reaching 0.0650 after breaking free from a multi-week trading range between 0.035–0.045.
✔︎ Price expansion caught many traders by surprise.
✔︎ Volume climbed to 15.78M, supporting the breakout.
✔︎ Market sentiment has shifted from accumulation to expansion.
◆━━━━━━━━━━━━━━━━━━━━━━━━━━━━━━━━◆
➤ Technical Analysis
① Trend: Bullish transition from prolonged sideways movement.
② Structure: Breakout above key resistance at 0.045.
③ Volume: Elevated participation confirms interest from buyers.
④ Momentum: Strong upward acceleration visible on the chart.
⑤ RSI: Extended conditions may lead to short-term cooling.
◆━━━━━━━━━━━━━━━━━━━━━━━━━━━━━━━━◆
➤ Scenario Analysis
🟢 Bullish: Holding above 0.050 could strengthen the breakout and support continuation higher.
🔴 Bearish: Falling back below 0.045 would weaken the bullish structure and increase retracement risk.
⚪ Neutral: Price forms a new base above previous resistance before another move.
◆━━━━━━━━━━━━━━━━━━━━━━━━━━━━━━━━◆
➤ Key Levels
✔︎ Resistance: 0.070 | 0.080
✔︎ Support: 0.045 | 0.038
◆━━━━━━━━━━━━━━━━━━━━━━━━━━━━━━━━◆
➜ Bottom Line
The breakout looks technically healthy, but the next few candles will determine whether KERNEL can convert former resistance into reliable support.
#kernel