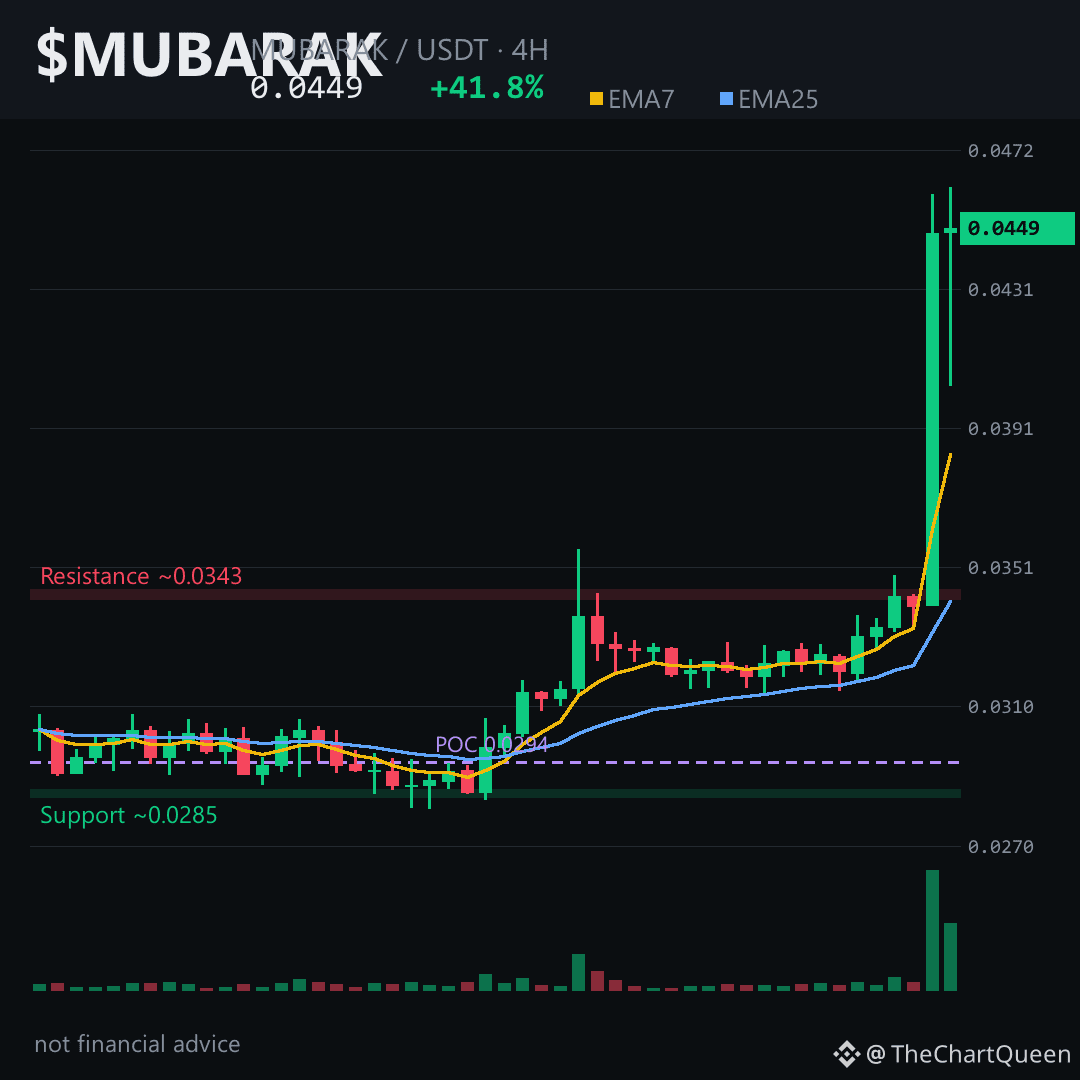
A single 4H candle just ate 32% in one bite.
That’s the kind of move that makes a chart feel less like a market and more like a slingshot snapping after being pulled back all week. And honestly? That’s exactly what this looks like.
$MUBARAK had been coiling quietly near the low 0.032s — barely moving, just breathing. Then the 08:00 candle ripped from 0.033960 to 0.045900, straight through every level that mattered, and it hasn’t given much back since.
Here’s the part worth slowing down for: the 4H chart is bullish, but it’s also stretched. RSI is deep in overbought territory, and the volume profile shows most historical interest much lower — around 0.029. That gap between price now and where liquidity used to live is the real story.
So the read is simple: momentum is real, but gravity hasn’t left the room.
The level I’m watching on the 4H is the current pivot around 0.0446. As long as $MUBARAK holds above the 0.0424 area on a closing basis, the bullish structure stays intact — and the next natural zone sits near 0.0486.
Lose 0.0424, though, and this read is off the table. That’s the line where the slingshot runs out of tension.
Funding is slightly positive, open interest is healthy, not euphoric. The crowd is leaning long, but not dangerously so.
My read: the trend is up, but the easy part of this move may already be done. The risk isn’t the direction — it’s the location.
I’ll keep an eye on how price behaves around that 0.0424–0.0446 pocket and post my next read as the structure develops. Follow along if you want the update.
What level are you watching most closely on $MUBARAK — the old breakout zone or the new highs? 👇
⚠️ Not financial advice. DYOR.
#MUBARAK #Crypto #BinanceSquare #MemeCoin #Altcoins
That’s the kind of move that makes a chart feel less like a market and more like a slingshot snapping after being pulled back all week. And honestly? That’s exactly what this looks like.
$MUBARAK had been coiling quietly near the low 0.032s — barely moving, just breathing. Then the 08:00 candle ripped from 0.033960 to 0.045900, straight through every level that mattered, and it hasn’t given much back since.
Here’s the part worth slowing down for: the 4H chart is bullish, but it’s also stretched. RSI is deep in overbought territory, and the volume profile shows most historical interest much lower — around 0.029. That gap between price now and where liquidity used to live is the real story.
So the read is simple: momentum is real, but gravity hasn’t left the room.
The level I’m watching on the 4H is the current pivot around 0.0446. As long as $MUBARAK holds above the 0.0424 area on a closing basis, the bullish structure stays intact — and the next natural zone sits near 0.0486.
Lose 0.0424, though, and this read is off the table. That’s the line where the slingshot runs out of tension.
Funding is slightly positive, open interest is healthy, not euphoric. The crowd is leaning long, but not dangerously so.
My read: the trend is up, but the easy part of this move may already be done. The risk isn’t the direction — it’s the location.
I’ll keep an eye on how price behaves around that 0.0424–0.0446 pocket and post my next read as the structure develops. Follow along if you want the update.
What level are you watching most closely on $MUBARAK — the old breakout zone or the new highs? 👇
⚠️ Not financial advice. DYOR.
#MUBARAK #Crypto #BinanceSquare #MemeCoin #Altcoins