DEEP ANALYSIS: Bedrock $BR Surge – Real Breakout or Short Squeeze? 📈🔥
Bedrock ($BR ) is making waves today with a massive +18.43% gain! Let’s break down the chart structure, order flow indicators, and critical price levels to watch.
📊 1. Current Market Metrics
* Current Price: $1.21787 (+18.43%)
* Mark Price: $1.21780
* 24h High: $1.40172
* 24h Low: $0.87931
* 24h Volume (BR): 356.85M BR
* 24h Volume (USDT): 398.34M USDT
🔍 2. Technical & Price Action Analysis
* Strong Bullish Momentum & Recovery:
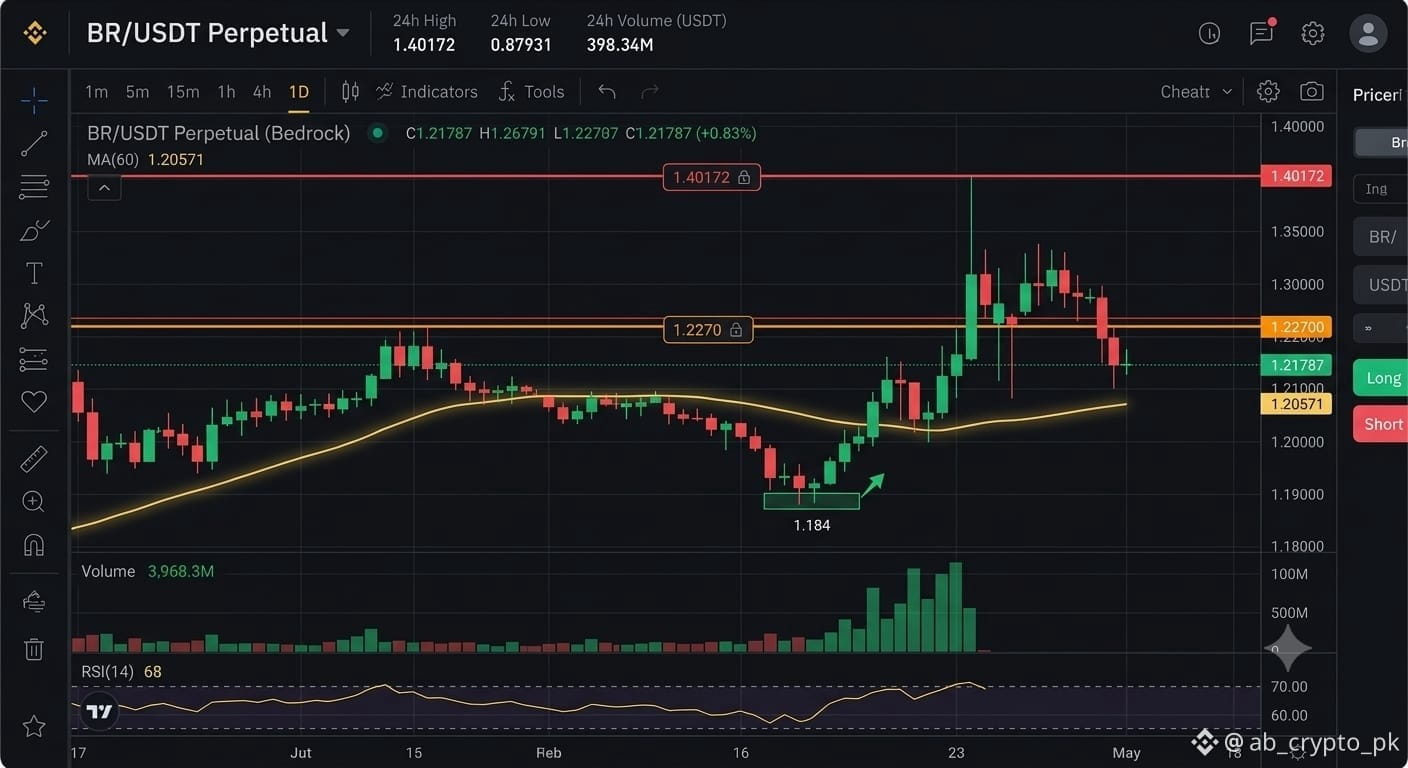
* After pulling back from the local spike near $1.227, price found local demand near $1.184 and rebounded sharply back to $1.217.
* The huge 398M+ USDT volume indicates intense market interest and liquidity inflow into Bedrock.
* MA60 Moving Average Dynamics:
* The MA60 ($1.20571) line has now been reclaimed by buyers and is curving upwards, shifting from dynamic resistance into immediate dynamic support.
* Holding above $1.205 keeps the short-term trend firmly in favor of the bulls.
* Volatility Range:
* Wide 24h spread between $0.879 and $1.401 shows elevated volatility. High volume spikes during the upward legs signal aggressive buying pressure.
🎯 3. Key Technical Levels
* 🛑 Immediate Resistance: $1.2270 ➔ $1.2500 ➔ $1.4017 (24h High)
* 🛡️ Key Support: $1.2057 (MA60) ➔ $1.1840 ➔ $1.0000
💡 4. Trading Outlook & Strategy
* Bullish Continuation: A sustained candle close above $1.227 opens the door for a potential retest of the $1.35 – $1.40 resistance zone.
* Pullback Scenario: If price dips below $1.205, look for consolidation around $1.184 before the next decisive move.
Are you Long or Short on Bedrock ($BR ) today? Share your thoughts in the comments! 👇
#BRUSDT #Bedrock #BinanceSquare #CryptoAnalysis #TechnicalAnalysis #CryptoTrading
#PerpetualFutures #Bullish #DYOR
Bedrock ($BR ) is making waves today with a massive +18.43% gain! Let’s break down the chart structure, order flow indicators, and critical price levels to watch.
📊 1. Current Market Metrics
* Current Price: $1.21787 (+18.43%)
* Mark Price: $1.21780
* 24h High: $1.40172
* 24h Low: $0.87931
* 24h Volume (BR): 356.85M BR
* 24h Volume (USDT): 398.34M USDT
🔍 2. Technical & Price Action Analysis
* Strong Bullish Momentum & Recovery:
* After pulling back from the local spike near $1.227, price found local demand near $1.184 and rebounded sharply back to $1.217.
* The huge 398M+ USDT volume indicates intense market interest and liquidity inflow into Bedrock.
* MA60 Moving Average Dynamics:
* The MA60 ($1.20571) line has now been reclaimed by buyers and is curving upwards, shifting from dynamic resistance into immediate dynamic support.
* Holding above $1.205 keeps the short-term trend firmly in favor of the bulls.
* Volatility Range:
* Wide 24h spread between $0.879 and $1.401 shows elevated volatility. High volume spikes during the upward legs signal aggressive buying pressure.
🎯 3. Key Technical Levels
* 🛑 Immediate Resistance: $1.2270 ➔ $1.2500 ➔ $1.4017 (24h High)
* 🛡️ Key Support: $1.2057 (MA60) ➔ $1.1840 ➔ $1.0000
💡 4. Trading Outlook & Strategy
* Bullish Continuation: A sustained candle close above $1.227 opens the door for a potential retest of the $1.35 – $1.40 resistance zone.
* Pullback Scenario: If price dips below $1.205, look for consolidation around $1.184 before the next decisive move.
Are you Long or Short on Bedrock ($BR ) today? Share your thoughts in the comments! 👇
#BRUSDT #Bedrock #BinanceSquare #CryptoAnalysis #TechnicalAnalysis #CryptoTrading
#PerpetualFutures #Bullish #DYOR