DAILY SIGNAL — SOL/USDT
Date: 21 Sep 2026 Timeframe: 1m Intraday Bias: Bullish continuation → breakout → upside Fibonacci liquidity
📊 Market Bias
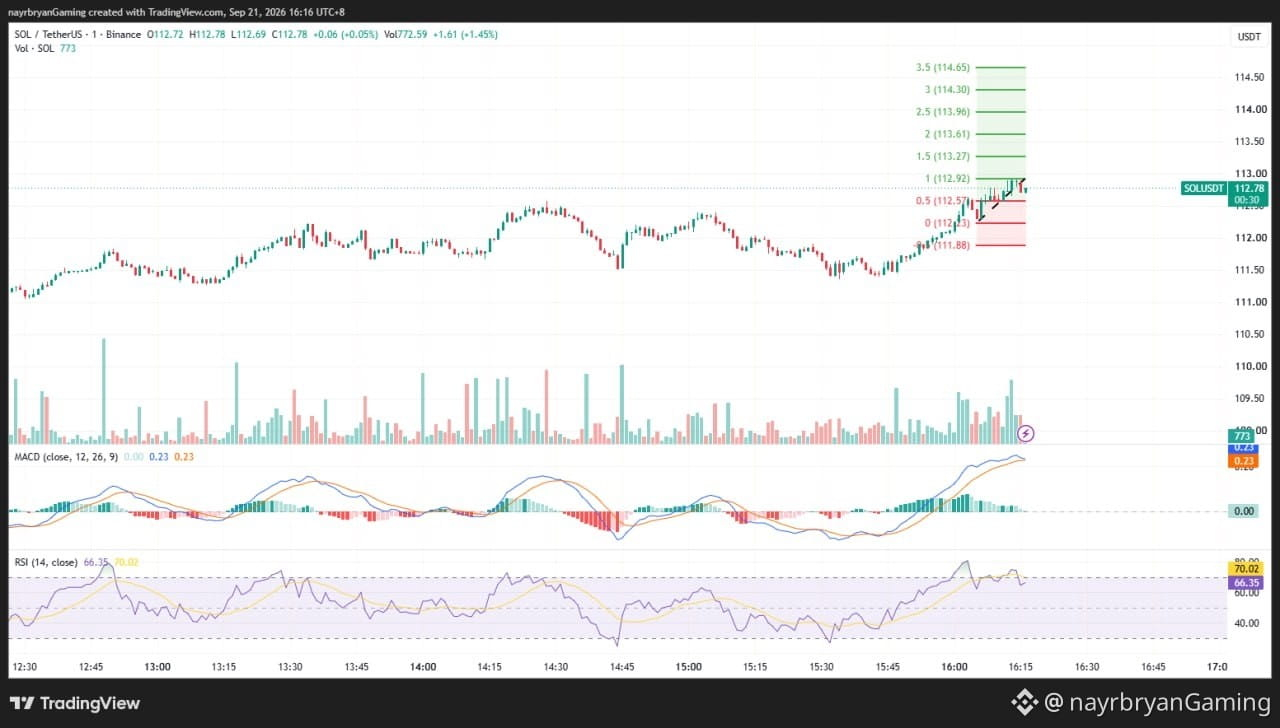
SOL is trading inside a rising channel and has pushed above the previous purple structure zone.
Price is currently around 112.74, above the 112.57 Fibonacci level and approaching the 112.92 1.0 Fib level.
The breakout structure remains constructive while price holds above the reclaimed 112.57 area.
🔹 Key Levels From Chart
Entry Zone — Long Reaction Bias: 112.57 → 112.74
Key Reclaim: 112.57
Near Resistance: 112.92
Invalidation: Below 112.21
🎯 Upside Fibonacci Targets
TP1 → 112.92 (1.0 Fib) TP2 → 113.27 (1.5 Fib) TP3 → 113.61 (2.0 Fib) TP4 → 113.96 (2.5 Fib) TP5 → 114.30 (3.0 Fib) TP6 → 114.65 (3.5 Fib)
📈 Technical Breakdown
SOL has been forming higher lows within the ascending channel.
The latest move pushed price through the purple resistance/structure zone and above the 112.57 Fibonacci level.
Momentum is currently positive, with MACD remaining above the zero line.
RSI is around 64.88, showing strong short-term momentum while approaching the upper momentum area.
A sustained hold above 112.57 keeps the upside Fibonacci structure in focus.
If price loses 112.21, the current bullish structure should be reassessed.
🧠 Quick Insight
“Breakouts become stronger when the reclaimed resistance turns into support.”
⚠️ Disclaimer
This is personal market analysis, not financial advice. This chart framework is for educational purposes only.
Always DYOR / DYODD, manage risk properly, and avoid emotional trading.
— @nayrbryanGaming #SOL #SOLUSDT #Crypto #Trading #TechnicalAnalysis #PriceAction #Fibonacci #Binance #DYOR #NFA #NoFOMO
Date: 21 Sep 2026 Timeframe: 1m Intraday Bias: Bullish continuation → breakout → upside Fibonacci liquidity
📊 Market Bias
SOL is trading inside a rising channel and has pushed above the previous purple structure zone.
Price is currently around 112.74, above the 112.57 Fibonacci level and approaching the 112.92 1.0 Fib level.
The breakout structure remains constructive while price holds above the reclaimed 112.57 area.
🔹 Key Levels From Chart
Entry Zone — Long Reaction Bias: 112.57 → 112.74
Key Reclaim: 112.57
Near Resistance: 112.92
Invalidation: Below 112.21
🎯 Upside Fibonacci Targets
TP1 → 112.92 (1.0 Fib) TP2 → 113.27 (1.5 Fib) TP3 → 113.61 (2.0 Fib) TP4 → 113.96 (2.5 Fib) TP5 → 114.30 (3.0 Fib) TP6 → 114.65 (3.5 Fib)
📈 Technical Breakdown
SOL has been forming higher lows within the ascending channel.
The latest move pushed price through the purple resistance/structure zone and above the 112.57 Fibonacci level.
Momentum is currently positive, with MACD remaining above the zero line.
RSI is around 64.88, showing strong short-term momentum while approaching the upper momentum area.
A sustained hold above 112.57 keeps the upside Fibonacci structure in focus.
If price loses 112.21, the current bullish structure should be reassessed.
🧠 Quick Insight
“Breakouts become stronger when the reclaimed resistance turns into support.”
⚠️ Disclaimer
This is personal market analysis, not financial advice. This chart framework is for educational purposes only.
Always DYOR / DYODD, manage risk properly, and avoid emotional trading.
— @nayrbryanGaming #SOL #SOLUSDT #Crypto #Trading #TechnicalAnalysis #PriceAction #Fibonacci #Binance #DYOR #NFA #NoFOMO