
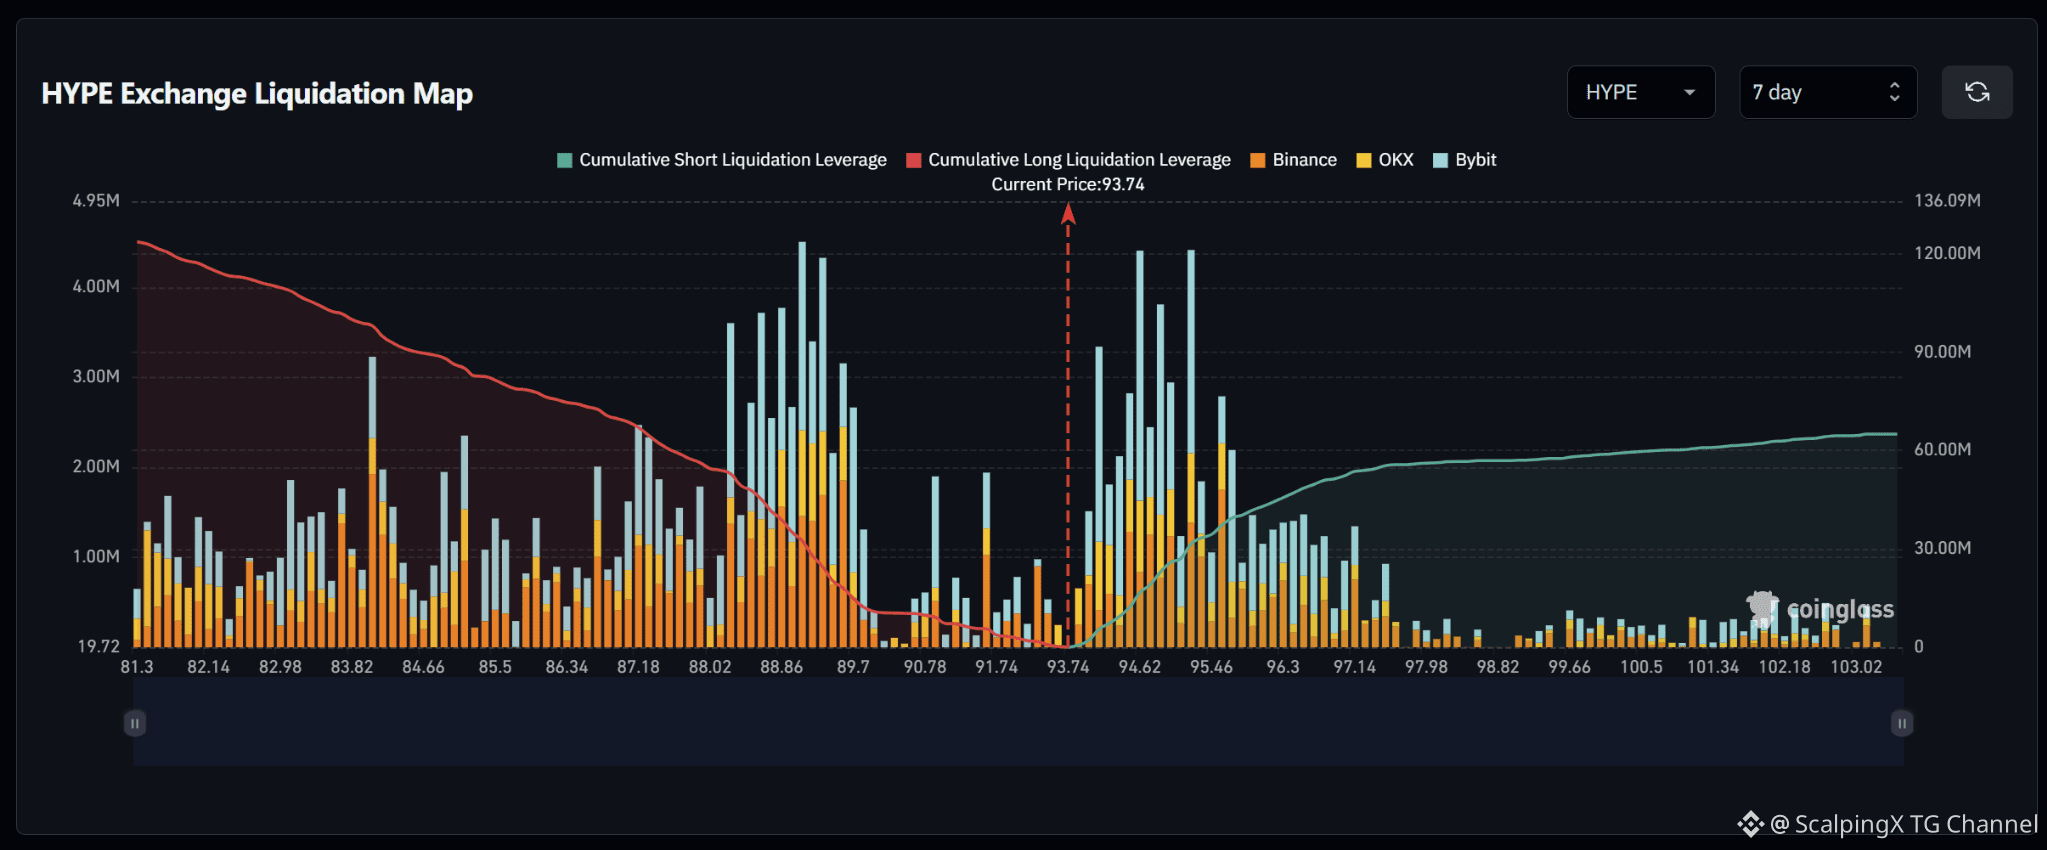
$HYPE – Liquidation Map (7 Days) – Current Price 93.74 🔎 The 7-day liquidation map shows roughly $120–125 million in long liquidations below the current price, significantly exceeding approximately $60–65 million in short liquidations above. The liquidity structure therefore clearly favors the downside, with nearly twice as much cumulative liquidity below the market. 📉 Below the market, long-liquidation liquidity is concentrated most heavily across 88–90. Major clusters around 88.5–89.5 contain several bars near $3.5–4.5 million, with the largest exceeding $4 million. Further down, 83.5–84.0 and 87.0–87.5 also hold notable liquidity pockets. Losing 92–91 would shift attention toward 90–89 and then 88–87. 📈 Above the market, short-liquidation liquidity is dense immediately across 94–96. The strongest clusters sit around 94.5–95.5 with several bars near $3–4.5 million, making this the most prominent nearby upside liquidity zone. The 96–97.5 area still holds multiple clusters, while liquidity becomes much thinner above 98. 🧭 The broader setup still favors the downside because long-liquidation exposure below is nearly twice as large. Losing 92–91 would increase the probability of a sweep toward 90–89 and then 88–87. Breaking above 94.5 would instead expose 95–95.5 before attention shifts toward 96–97.

Veröffentlichen
Haftungsausschluss: Enthält Meinungen von Drittanbietern. Keine Beratung. Binance AI wird ohne Gewähr bereitgestellt. Siehe AGB.