Imagine a coin that just fell down a flight of stairs and is now checking if anything's broken.
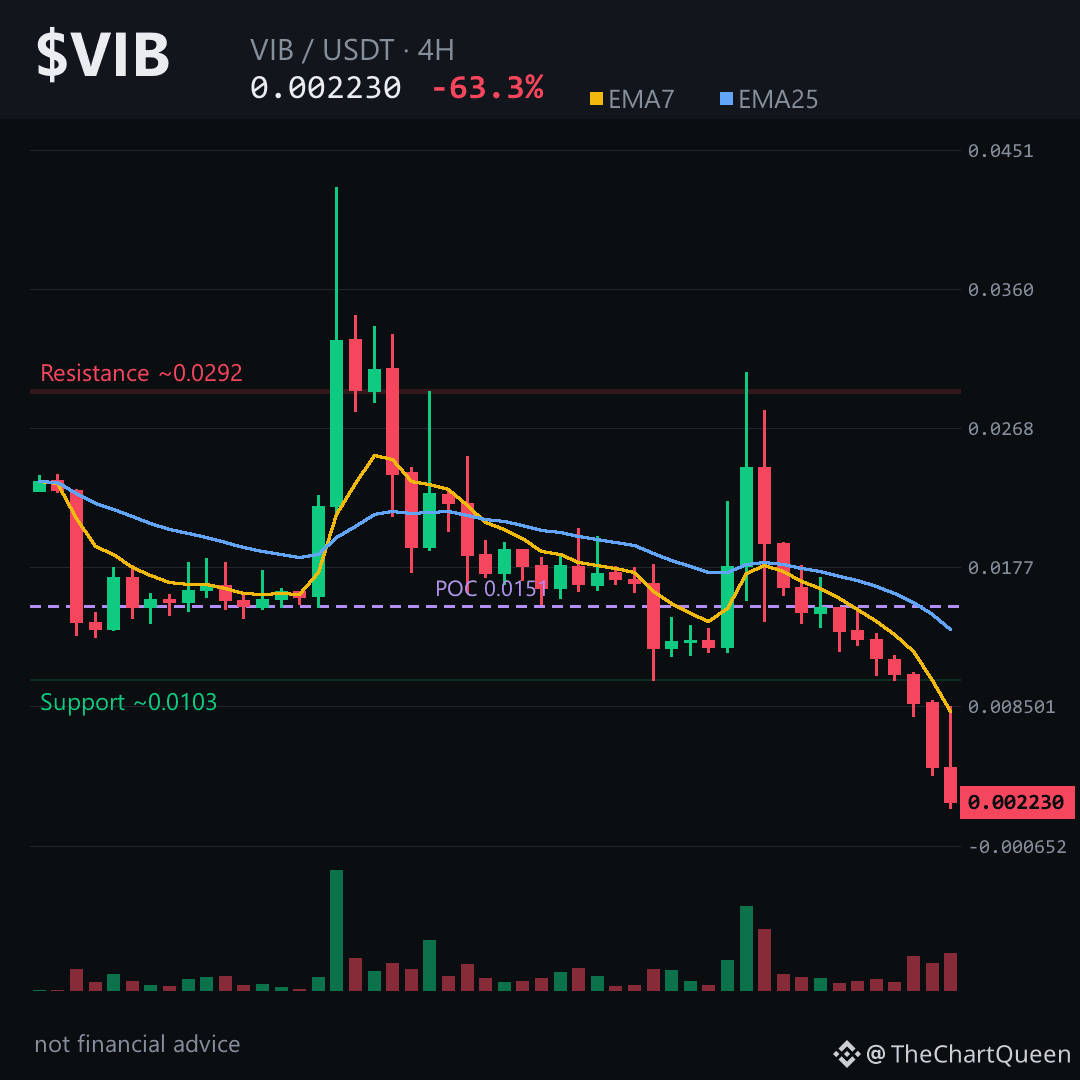
$VIB printed a -63% day. The kind of number that makes you stop mid-scroll.
The 4H chart shows an unfilled bearish gap between roughly 0.0089 and 0.0102. Price blew through it so fast, it never looked back.
RSI is near 28, and the short-term moving average trades at roughly half the level of the longer one. Momentum is exhausted, but no buyers are stepping in yet.
Daily picture: every bounce got sold. Last 12 candles? Two green, ten red. That’s not a pullback — that’s a liquidation cascade with nobody catching the knife.
Now, the levels matter more than the drama.
If $VIB can't reclaim the ~0.235 area on the 4H chart, this read stays bearish. That's the line where the thesis breaks down — a close above it means sellers lost control. Until then, the path of least resistance points toward the ~0.204 zone, where prior structure might offer support.
Tap $VIB to pull up the chart and see how clean that breakdown looks.
My read: the trend is decisively down, but the real risk isn't more downside — it's the violent bounce that often follows a -63% candle. Chasing shorts down here could hurt more than respecting the trend.
I'll be watching how VIB behaves around that 0.204 zone in the next session — follow along if you want the update when it gets there.
What level are you watching on this chart? 👇
⚠️ Not financial advice. DYOR.
#VIB #Crypto #BinanceSquare #Altcoins
$VIB printed a -63% day. The kind of number that makes you stop mid-scroll.
The 4H chart shows an unfilled bearish gap between roughly 0.0089 and 0.0102. Price blew through it so fast, it never looked back.
RSI is near 28, and the short-term moving average trades at roughly half the level of the longer one. Momentum is exhausted, but no buyers are stepping in yet.
Daily picture: every bounce got sold. Last 12 candles? Two green, ten red. That’s not a pullback — that’s a liquidation cascade with nobody catching the knife.
Now, the levels matter more than the drama.
If $VIB can't reclaim the ~0.235 area on the 4H chart, this read stays bearish. That's the line where the thesis breaks down — a close above it means sellers lost control. Until then, the path of least resistance points toward the ~0.204 zone, where prior structure might offer support.
Tap $VIB to pull up the chart and see how clean that breakdown looks.
My read: the trend is decisively down, but the real risk isn't more downside — it's the violent bounce that often follows a -63% candle. Chasing shorts down here could hurt more than respecting the trend.
I'll be watching how VIB behaves around that 0.204 zone in the next session — follow along if you want the update when it gets there.
What level are you watching on this chart? 👇
⚠️ Not financial advice. DYOR.
#VIB #Crypto #BinanceSquare #Altcoins