Why does $WTC keep finding new lows when it already looks “cheap”?
Price has fallen over 56% in a single day — and the chart says the pain may not be done. Here's what most people miss: a falling knife can stay sharp even after a bounce.
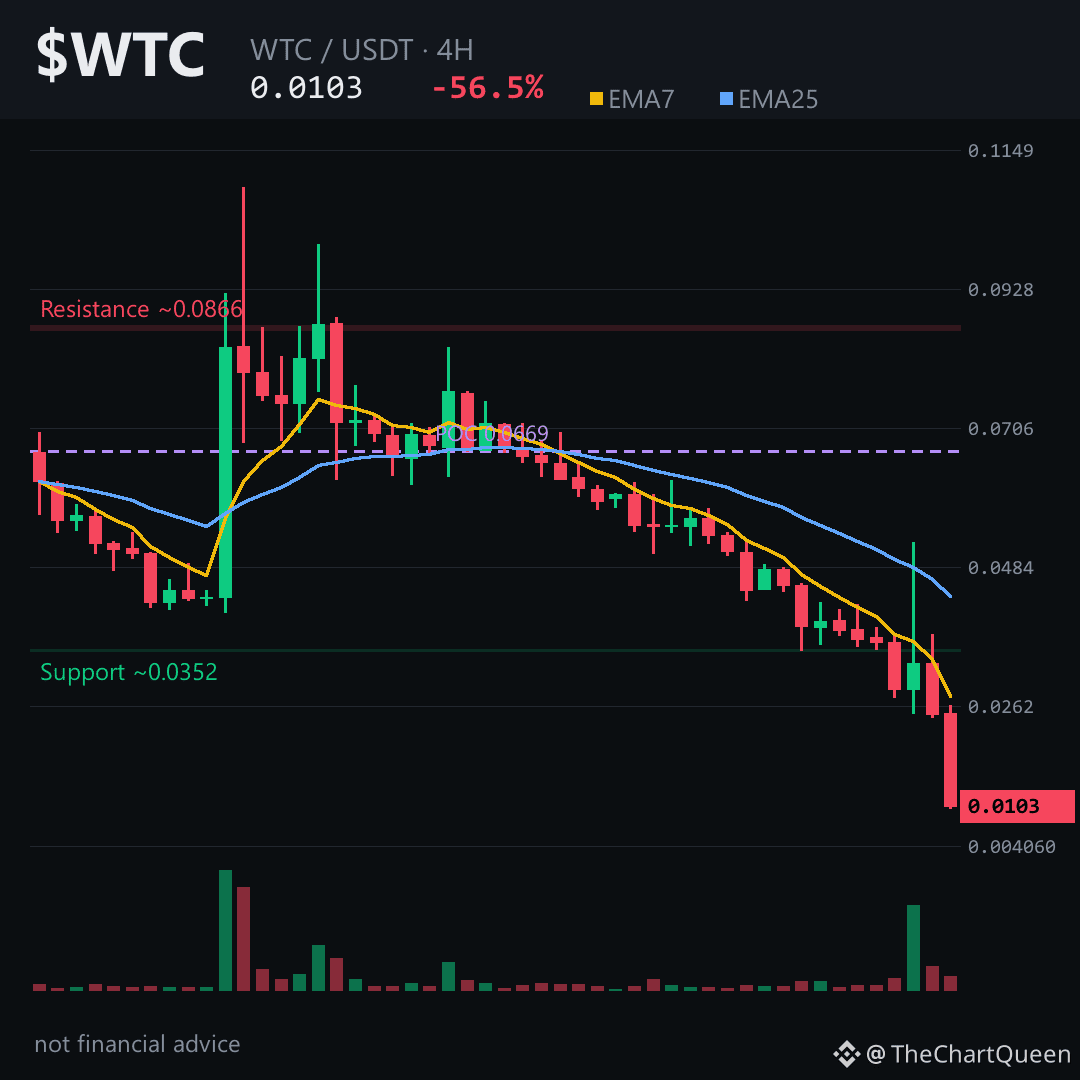
The 4-hour picture is the cleanest read. Price sits near 0.0103, barely above its 24-hour low. The EMA7 is sloping hard below the EMA25 — that’s a short-term trend line telling you sellers are still in control. RSI is sitting near 20, which sounds oversold, but in strong downtrends RSI can stay low for a long time. It’s not a green light by itself.
The key zone to watch is 0.0103–0.0109. As long as $WTC stays under that 0.0109 area, the path of least resistance points lower — toward the 0.0094 zone, which is the next liquidity pocket from the 4H range. Lose that and the macro picture opens the door toward the 0.0065 area, though that’s a bigger-picture target, not an overnight move.
My read: this is a falling-knife chart. A bounce is possible from oversold conditions, but until price reclaims 0.0109 on a 4H close, any strength looks like a pause, not a reversal. The real risk is catching a bounce that never comes.
Tap $WTC to pull up the chart and see these zones yourself.
What level are you watching to decide if this is a bottom or just a breather? 👇
Not financial advice. DYOR.
Follow for the next read on this chart.
#WTC #Crypto #BinanceSquare #Altcoins
Price has fallen over 56% in a single day — and the chart says the pain may not be done. Here's what most people miss: a falling knife can stay sharp even after a bounce.
The 4-hour picture is the cleanest read. Price sits near 0.0103, barely above its 24-hour low. The EMA7 is sloping hard below the EMA25 — that’s a short-term trend line telling you sellers are still in control. RSI is sitting near 20, which sounds oversold, but in strong downtrends RSI can stay low for a long time. It’s not a green light by itself.
The key zone to watch is 0.0103–0.0109. As long as $WTC stays under that 0.0109 area, the path of least resistance points lower — toward the 0.0094 zone, which is the next liquidity pocket from the 4H range. Lose that and the macro picture opens the door toward the 0.0065 area, though that’s a bigger-picture target, not an overnight move.
My read: this is a falling-knife chart. A bounce is possible from oversold conditions, but until price reclaims 0.0109 on a 4H close, any strength looks like a pause, not a reversal. The real risk is catching a bounce that never comes.
Tap $WTC to pull up the chart and see these zones yourself.
What level are you watching to decide if this is a bottom or just a breather? 👇
Not financial advice. DYOR.
Follow for the next read on this chart.
#WTC #Crypto #BinanceSquare #Altcoins