LIGHT ANALYSIS / CHART SETUP — SOL/USDT
📈 Structure Overview
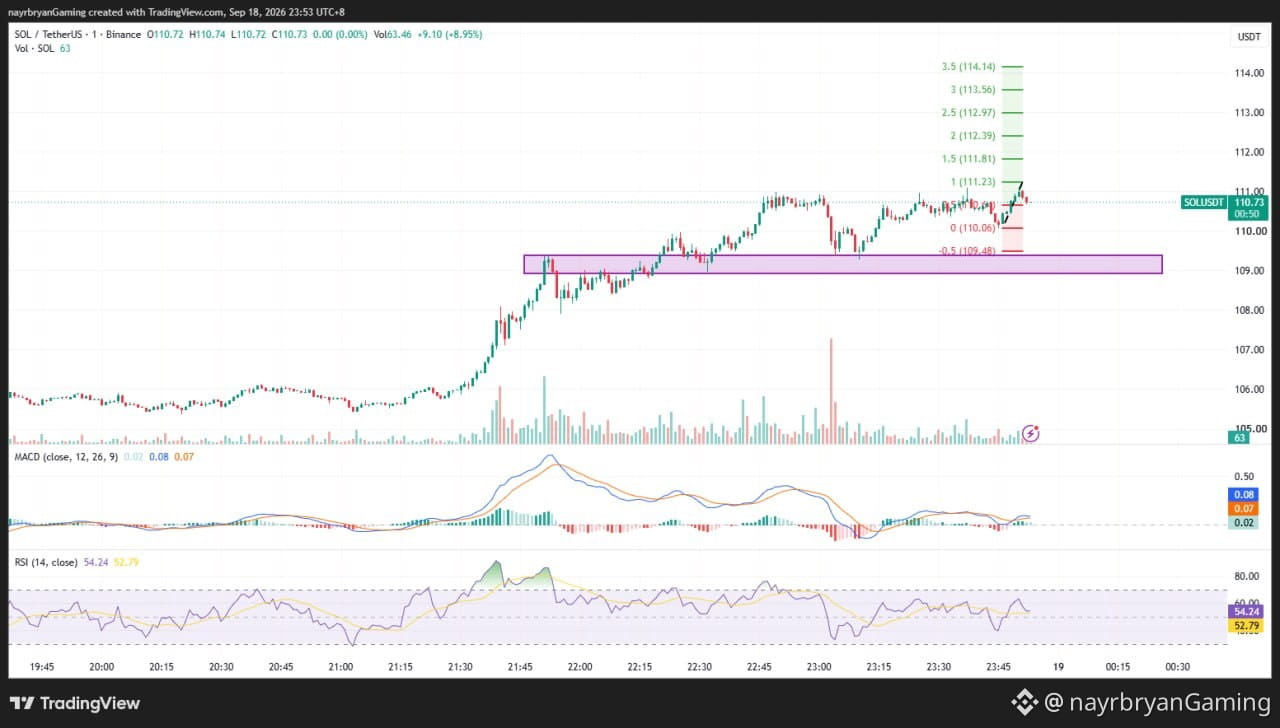
Market phase: Recovery → Ascending Channel → Pullback
Primary structure: Higher lows inside a rising channel
Current reaction zone: 110.06 – 110.64
Key upside level: 111.23
Major invalidation: 109.48
📌 What I’m Watching
Scenario A — Bullish Continuation
If SOL holds the 110.06–110.64 area, price may rotate toward:
111.23 → 111.81 → 112.39 → 112.97 → 113.56 → 114.14
These levels correspond with the Fibonacci extensions marked on the chart.
Scenario B — Deeper Pullback
If SOL loses 110.06, the next structure to watch is:
109.48
A break below 109.48 would weaken the current continuation framework and bring the lower channel/support area into focus.
📊 Indicator Check
MACD: Slightly positive → momentum remains constructive
RSI: Around 50 → neutral momentum
Price Structure: Ascending channel + higher lows
Key Confirmation: 110.06 hold / 109.48 failure
Note: This is a chart framework, not a trade recommendation. Use it to support your own DYOR-based execution plan.
— @nayrbryanGaming #SOLAnalysis #ChartSetup #PriceAction #SmartMoney #Fibonacci #CryptoTrading #DYOR #NFA
📈 Structure Overview
Market phase: Recovery → Ascending Channel → Pullback
Primary structure: Higher lows inside a rising channel
Current reaction zone: 110.06 – 110.64
Key upside level: 111.23
Major invalidation: 109.48
📌 What I’m Watching
Scenario A — Bullish Continuation
If SOL holds the 110.06–110.64 area, price may rotate toward:
111.23 → 111.81 → 112.39 → 112.97 → 113.56 → 114.14
These levels correspond with the Fibonacci extensions marked on the chart.
Scenario B — Deeper Pullback
If SOL loses 110.06, the next structure to watch is:
109.48
A break below 109.48 would weaken the current continuation framework and bring the lower channel/support area into focus.
📊 Indicator Check
MACD: Slightly positive → momentum remains constructive
RSI: Around 50 → neutral momentum
Price Structure: Ascending channel + higher lows
Key Confirmation: 110.06 hold / 109.48 failure
Note: This is a chart framework, not a trade recommendation. Use it to support your own DYOR-based execution plan.
— @nayrbryanGaming #SOLAnalysis #ChartSetup #PriceAction #SmartMoney #Fibonacci #CryptoTrading #DYOR #NFA