
🚨 **$ETH LOSES KEY MOVING AVERAGE SUPPORT AS SELLER PRESSURE ACCELERATES!** 📉
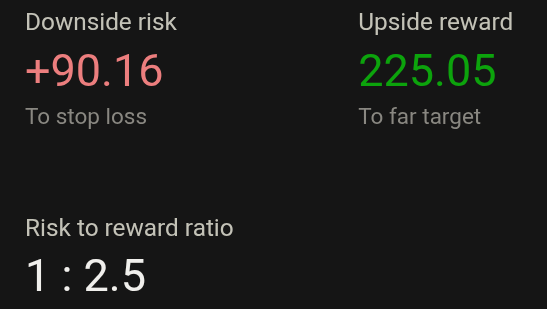
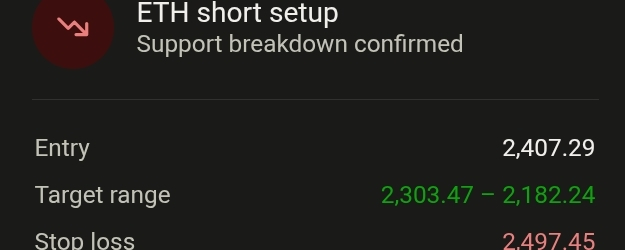
**Entry:** 2,407.29 ⚡
**Target:** 2,303.47 – 2,182.24 🚀
**Stop Loss:** 2,497.45 ⚠️
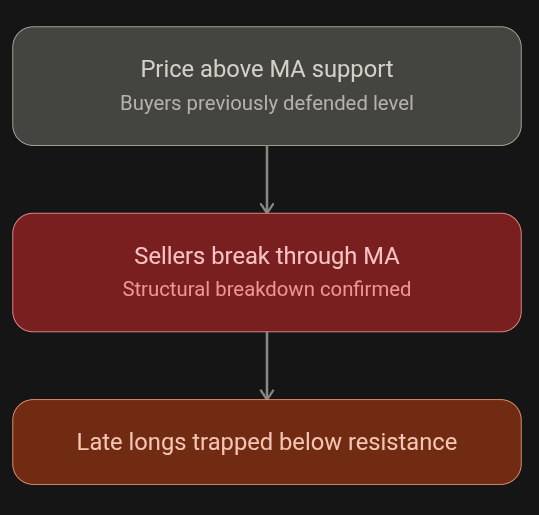
Ethereum has just delivered a decisive technical breakdown that traders can't afford to ignore. 🔥 Sellers sliced clean through a critical moving average support level, a level that had acted as a floor for weeks. Late longs are now trapped directly beneath overhead resistance, with little room to maneuver before the next wave of selling pressure kicks in. 📊
This isn't a minor wobble — it's a **structural breakdown**. When price action confirms this kind of shift, it tells us momentum has firmly flipped to the downside. Order flow is aligning with what looks like institutional distribution, meaning larger players may be quietly offloading positions into any strength. 🐋
**What's happening under the hood?**
Smart money appears to be hunting for shallow relief bounces — using any short-term pullback into resistance as an opportunity to build fresh short exposure ahead of the next leg down. 📌 Overhead supply is piling up fast, and the bids sitting under key levels look increasingly fragile against aggressive market sell orders.
**Key levels to watch:**
🔸 Entry Zone: 2,407.29
🔸 Downside Target Range: 2,303.47 – 2,182.24
🔸 Invalidation / Stop Loss: 2,497.45
If ETH fails to reclaim the lost moving average support with strong volume, the path of least resistance remains lower. A break below 2,300 could open the door toward the deeper 2,182 zone. Conversely, a strong reclaim above 2,497 would invalidate this bearish structure and shift the narrative back toward buyers. ⚠️
💬 **Question for the community:** Are you waiting for a clean pullback to short the retest, or are you hunting for a reversal bottom instead? 👇
Drop your thoughts and levels below — let's see how the community is positioned heading into the next session! 🚀📈
#ETH #btc #CryptoTrading #Binance #TechnicalAnalysis