
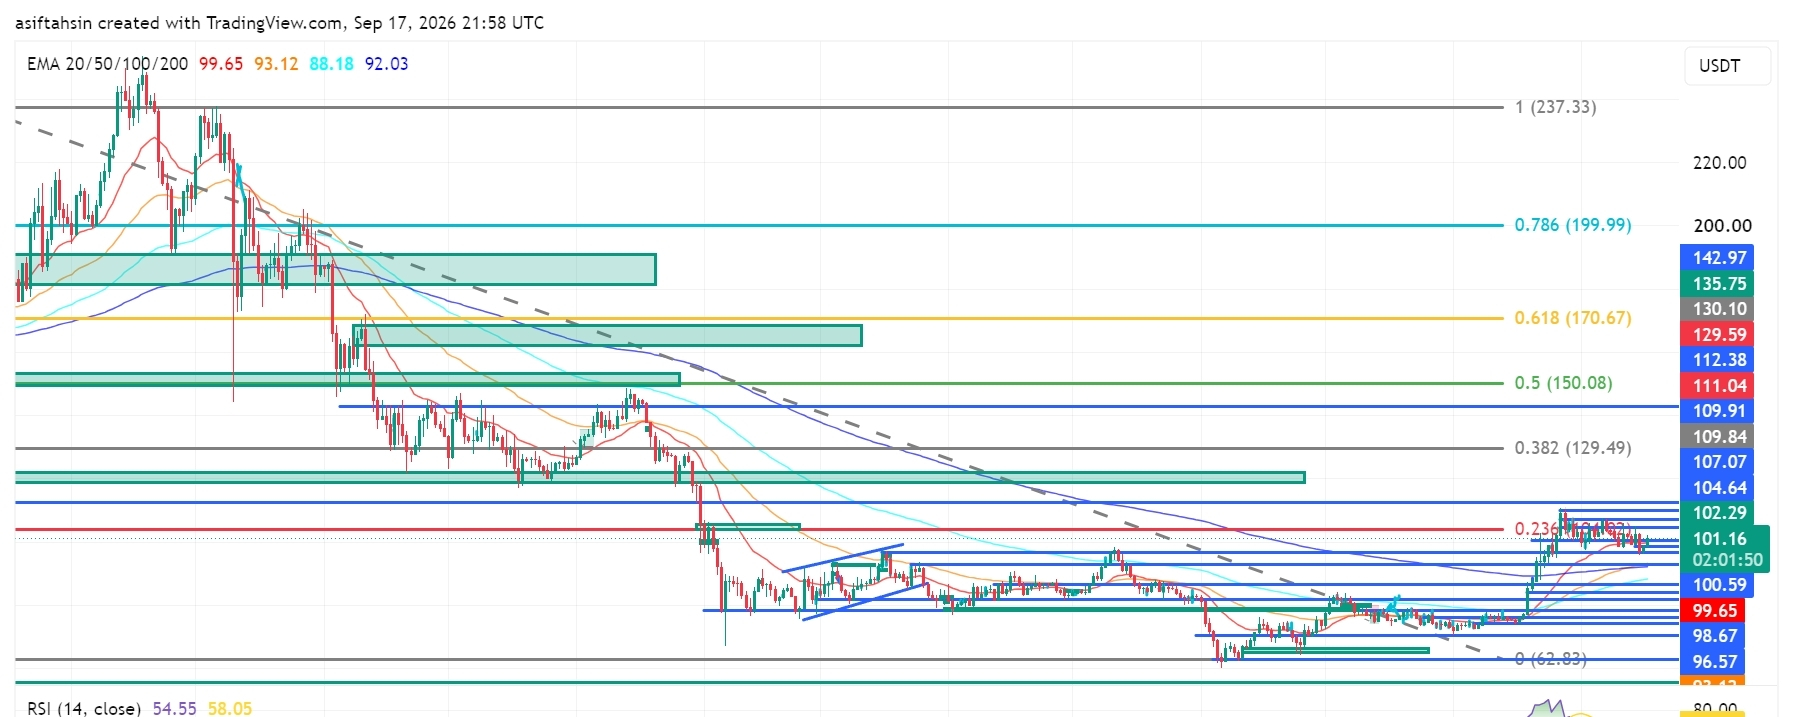

SOL is currently trading around $101.16, holding above the $99–$100 breakout zone after the recent bullish expansion from the $92–$94 demand area.
The broader recovery structure remains constructive, but SOL is now consolidating below the $102.29–$107.07 resistance cluster. Bulls need to reclaim this area and break the $109.91–$112.38 zone for the next major upside expansion.
📈 EMA Structure
- 20 EMA: $99.65
- 50 EMA: $93.12
- 100 EMA: $88.18
- 200 EMA: $92.03
SOL is currently trading above the 20 EMA at $99.65.
The recovery above the 50 EMA at $93.12 and 200 EMA at $92.03 keeps the broader recovery structure intact.
A sustained hold above the 20 EMA would support short-term momentum, while losing the $93.12–$92.03 area would weaken the current structure.
📐 Fibonacci Levels
Key Fibonacci levels:
- 0.236: $104.64
- 0.382: $129.49
- 0.5: $150.08
- 0.618: $170.67
- 0.786: $199.99
- 1.0: $237.33
SOL is currently trading below the 0.236 Fibonacci level at $104.64.
The next major Fibonacci resistance is $129.49 — 0.382 Fib.
A sustained breakout through the $104–$112 resistance structure could open the path toward the $129.49 region.
🟢 Bullish Scenario
SOL is consolidating after the recent recovery and is currently maintaining acceptance above the $100 area.
Immediate resistance:
- $102.29
- $104.64 — 0.236 Fibonacci
- $107.07
- $109.84
- $109.91
- $111.04
- $112.38
A clean breakout and sustained close above $111.04–$112.38 would provide stronger confirmation of bullish continuation.
🎯 Target 1: $104.64
🎯 Target 2: $107.07
🎯 Target 3: $109.91
🎯 Target 4: $112.38
🎯 Target 5: $129.49 — 0.382 Fibonacci
🎯 Target 6: $150.08 — 0.5 Fibonacci
A confirmed breakout above the $111–$112 zone could strengthen the medium-term recovery structure and potentially accelerate SOL toward the $129–$150 region.
🔴 Pullback Scenario
After the recent bullish expansion, a retest of the breakout area would be normal.
Key supports:
- $100.59
- $99.65 — 20 EMA
- $98.67
- $96.57
- $93.12 — 50 EMA
- $92.94
- $92.03 — 200 EMA
- $88.18 — 100 EMA
The $96–$100 zone is particularly important.
If SOL continues to hold this area during a pullback, the current recovery structure remains active.
A sustained loss of $92.03 would weaken the current structure and could expose the $88.18 support zone.
🧠 Market Structure & Liquidity
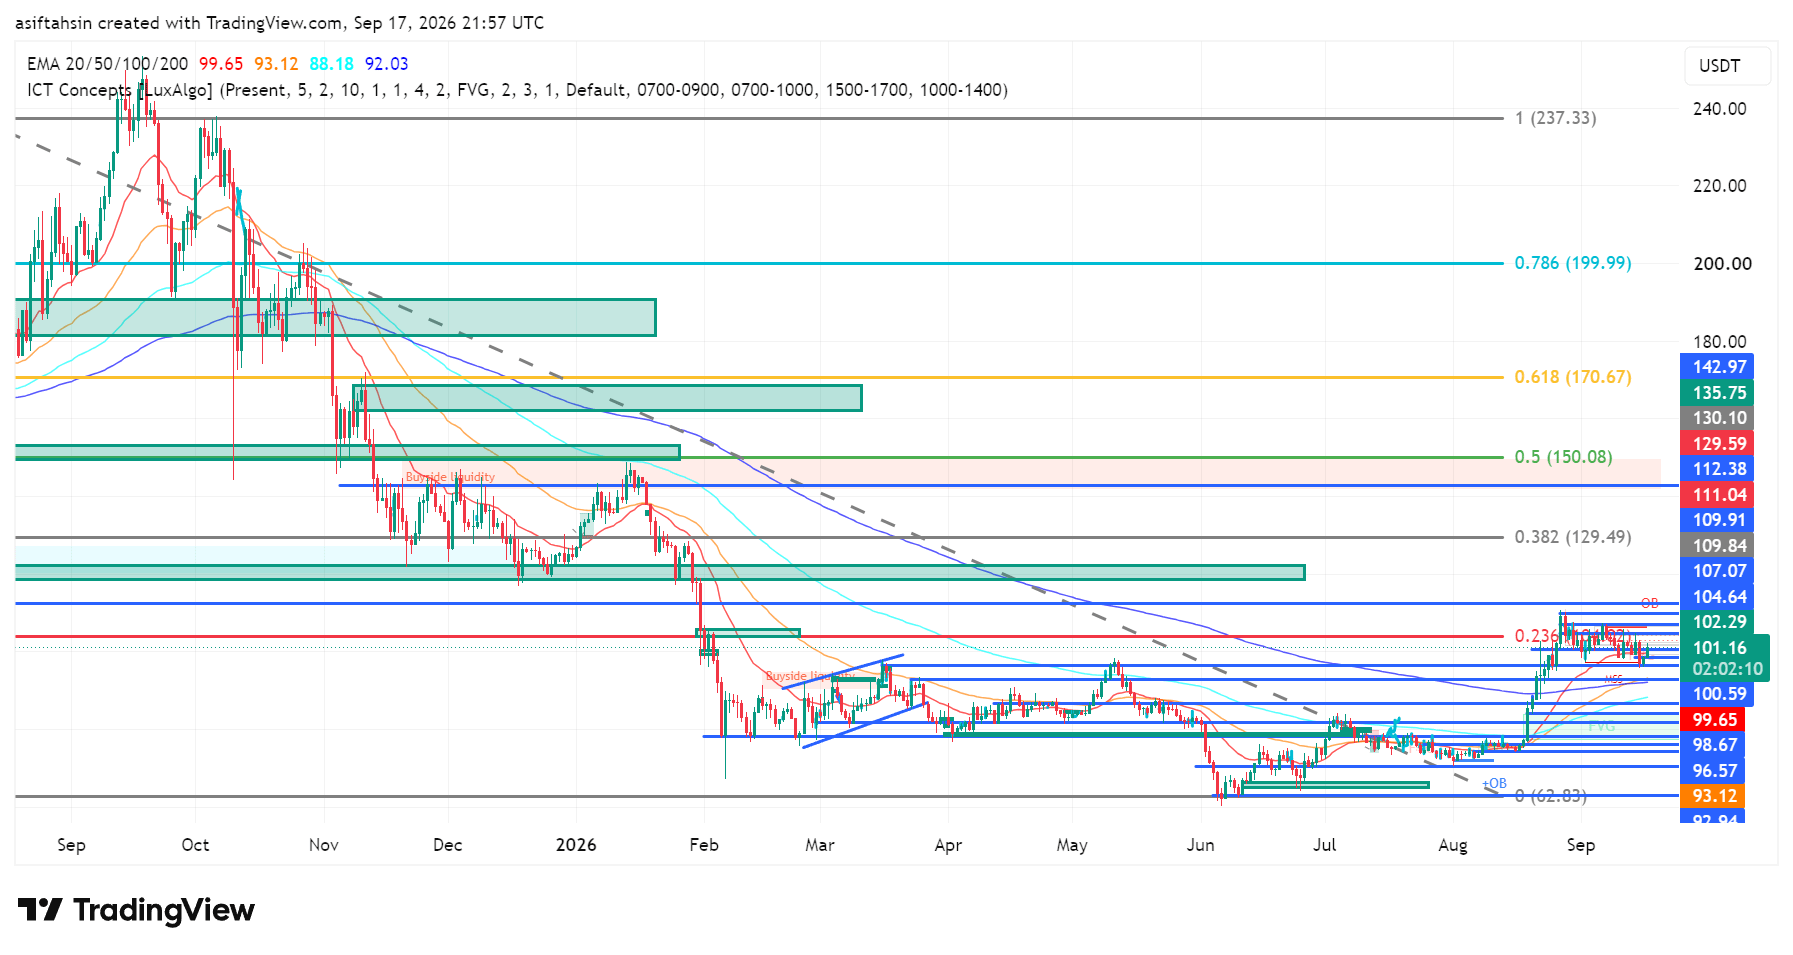
SOL has formed a clear recovery structure after sweeping liquidity around the $92–$94 demand region.
The recent move produced a market-structure shift followed by a breakout and higher-low formation.
SOL is now moving through an important:
Breakout → Retest → Consolidation → Continuation
structure.
The major upside liquidity is concentrated around $102–$112. A decisive breakout above this zone would place $129.49 as the next major Fibonacci reference.
📊 RSI Momentum
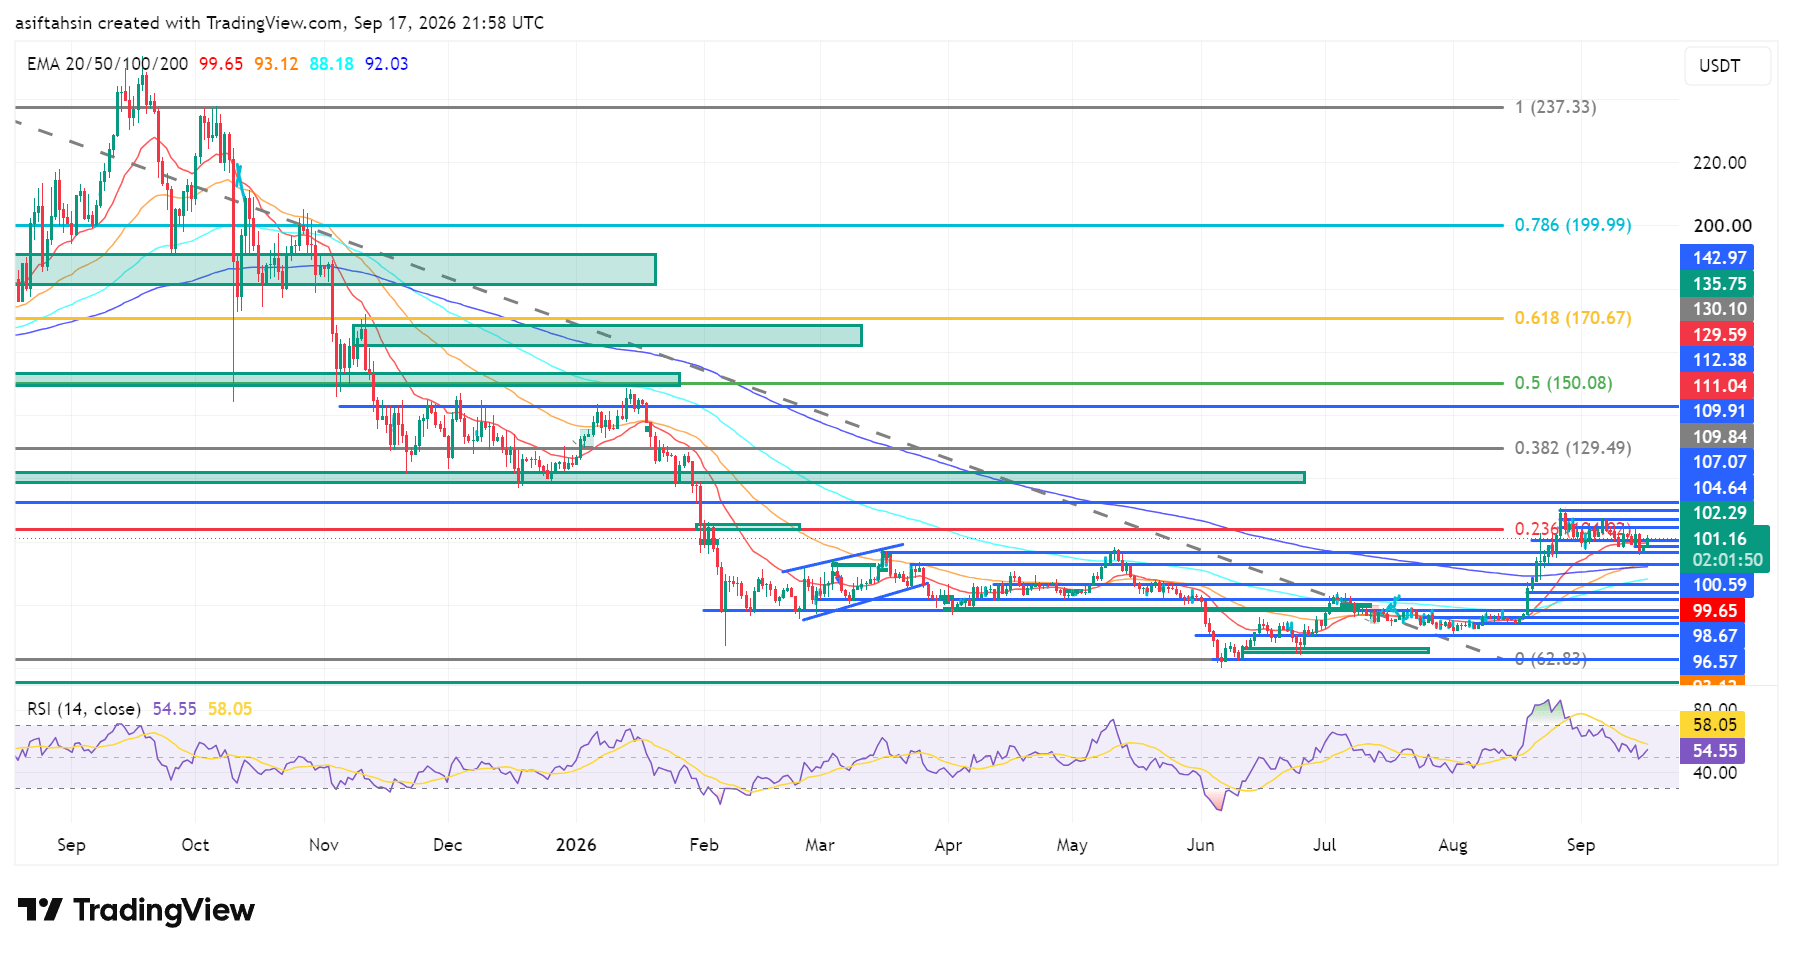
RSI (14): 54.55
RSI remains above the neutral 50 level after cooling from the recent bullish expansion.
The current reading shows moderately positive momentum without reaching an extreme zone.
A sustained RSI move above 55–60 would indicate improving momentum toward the upper resistance area.
A move back below 50 would indicate increasing short-term momentum weakness.
🎯 Key Levels
🔴 Major Resistance: $102.29 → $104.64 → $107.07 → $109.91 → $111.04 → $112.38
🟢 Major Support: $100.59 → $99.65 → $98.67 → $96.57 → $93.12 → $92.03
📉 Dynamic EMA Support: $99.65 — 20 EMA | $93.12 — 50 EMA | $92.03 — 200 EMA | $88.18 — 100 EMA
🚀 Upside Targets: $112.38 → $129.49 → $150.08 → $170.67
📌 Final Outlook
SOL's broader structure remains constructive after the recent breakout, with price holding above the $99–$100 region.
The $96–$100 area is now an important short-term support region. As long as SOL maintains this area, the current recovery structure remains active.
The immediate battle is around $102–$112. A confirmed breakout above $112.38 could open the path toward $129.49, followed by $150.08 and potentially $170.67.
However, rejection from resistance followed by a sustained loss of $92.03 would weaken the current structure and increase the possibility of a deeper retracement toward the $88.18 area.
Bias: 🟢 Recovery structure intact above $92.03. A breakout above $112.38 could open the path toward $129.49, with $150.08 as the next major Fibonacci target.
