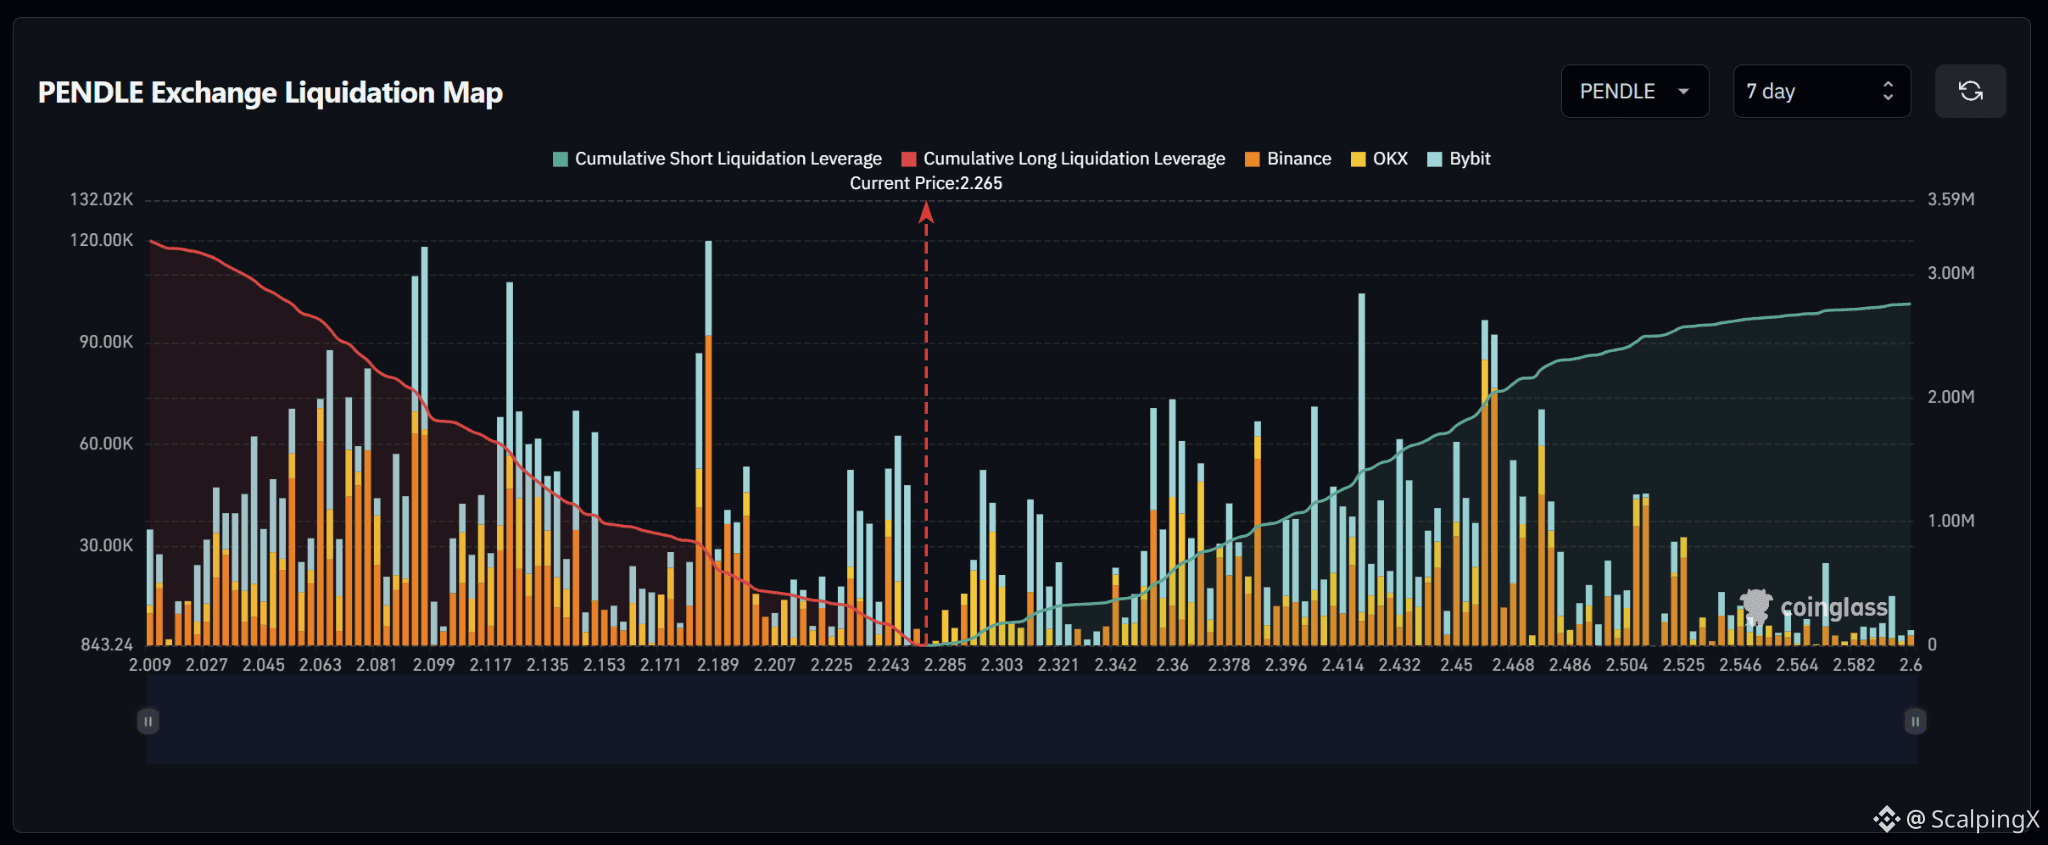
$PENDLE – Liquidation Map (7 Days) – Current Price 2.265
🔎 The 7-day liquidation map shows roughly $3.1–3.2 million in long liquidations below the current price, exceeding approximately $2.6–2.7 million in short liquidations above. The overall structure is therefore relatively balanced with a mild downside tilt.
📉 Below the market, long-liquidation liquidity is concentrated heavily across 2.04–2.19. Major clusters appear around 2.09–2.10 with a bar near $120,000, around 2.11–2.13 with a bar above $100,000, and near 2.188–2.190 with a bar around $120,000. Losing 2.243 would shift attention toward 2.225–2.207 and then 2.19–2.17.
📈 Above the market, short-liquidation liquidity begins building from 2.285 and becomes denser across 2.34–2.49. A major cluster sits near 2.414 with a bar above $100,000, while 2.45–2.47 contains several bars around $90,000–100,000. The 2.36–2.40 area also holds multiple medium-sized clusters.
🧭 The current setup slightly favors the downside because long-liquidation exposure below is roughly 1.2 times larger. Losing 2.243 would increase the probability of a sweep toward 2.225–2.207; breaking above 2.285 would instead shift attention toward 2.34–2.41 and then 2.45–2.49.
🔎 The 7-day liquidation map shows roughly $3.1–3.2 million in long liquidations below the current price, exceeding approximately $2.6–2.7 million in short liquidations above. The overall structure is therefore relatively balanced with a mild downside tilt.
📉 Below the market, long-liquidation liquidity is concentrated heavily across 2.04–2.19. Major clusters appear around 2.09–2.10 with a bar near $120,000, around 2.11–2.13 with a bar above $100,000, and near 2.188–2.190 with a bar around $120,000. Losing 2.243 would shift attention toward 2.225–2.207 and then 2.19–2.17.
📈 Above the market, short-liquidation liquidity begins building from 2.285 and becomes denser across 2.34–2.49. A major cluster sits near 2.414 with a bar above $100,000, while 2.45–2.47 contains several bars around $90,000–100,000. The 2.36–2.40 area also holds multiple medium-sized clusters.
🧭 The current setup slightly favors the downside because long-liquidation exposure below is roughly 1.2 times larger. Losing 2.243 would increase the probability of a sweep toward 2.225–2.207; breaking above 2.285 would instead shift attention toward 2.34–2.41 and then 2.45–2.49.