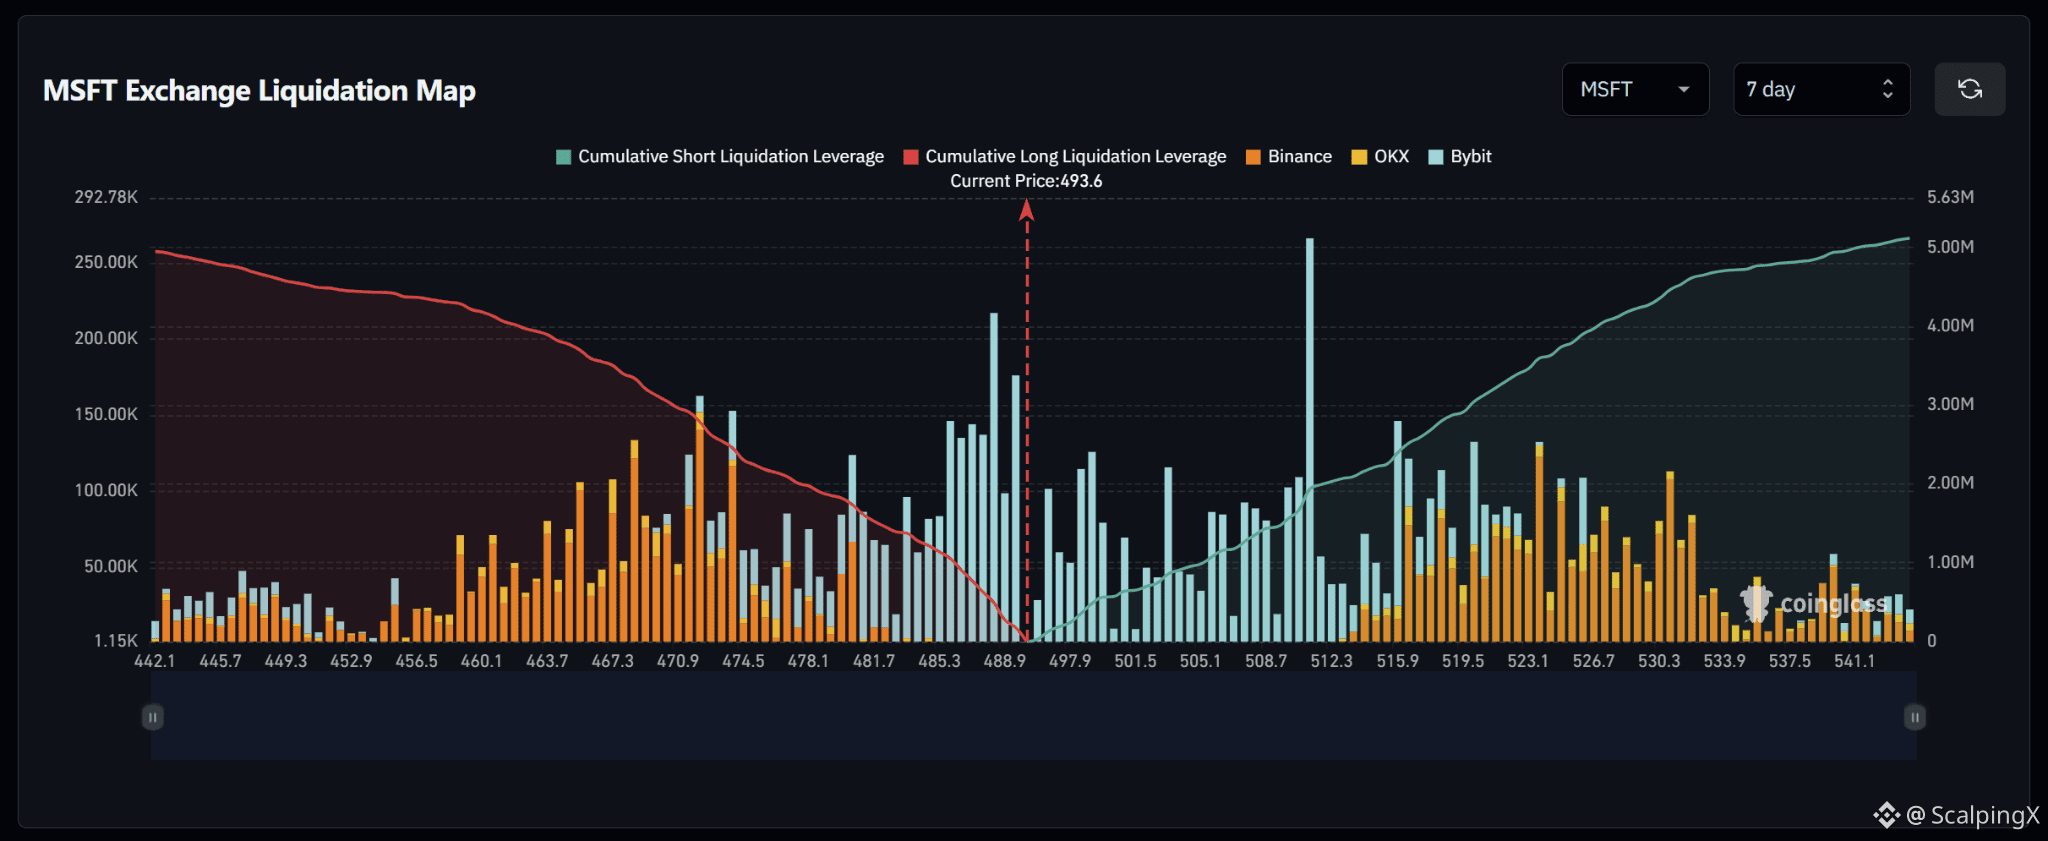
$MSFT – Liquidation Map (7 Days) – Current Price 493.6
🔎 The 7-day liquidation map shows a fairly balanced structure, with roughly $5.0–5.1 million in short liquidations above the current price and around $4.9–5.0 million in long liquidations below. The difference is small, so there is no strong directional imbalance yet.
📉 Below the market, long-liquidation liquidity is concentrated heavily across 467–489. Notable clusters appear around 470–474 with several bars near $120,000–160,000, while 486–489 contains a larger cluster with the tallest bar above $200,000. Losing 488.9 would shift attention toward 485–481 and then 474–470.
📈 Above the market, short-liquidation liquidity begins building clearly from 497 and becomes denser across 505–527. The strongest cluster sits around 511–512 with a bar near $260,000; the 515–520 and 523–527 areas also contain several bars around $100,000–145,000. Further out, 530–531 still holds several notable clusters.
🧭 The broader setup is currently balanced. Breaking above 497.9 would increase the probability of a sweep toward 505–512; if momentum continues, 515–527 becomes the next liquidity zone. Losing 488.9 would instead shift attention toward 485–481 and then 474–470.
🔎 The 7-day liquidation map shows a fairly balanced structure, with roughly $5.0–5.1 million in short liquidations above the current price and around $4.9–5.0 million in long liquidations below. The difference is small, so there is no strong directional imbalance yet.
📉 Below the market, long-liquidation liquidity is concentrated heavily across 467–489. Notable clusters appear around 470–474 with several bars near $120,000–160,000, while 486–489 contains a larger cluster with the tallest bar above $200,000. Losing 488.9 would shift attention toward 485–481 and then 474–470.
📈 Above the market, short-liquidation liquidity begins building clearly from 497 and becomes denser across 505–527. The strongest cluster sits around 511–512 with a bar near $260,000; the 515–520 and 523–527 areas also contain several bars around $100,000–145,000. Further out, 530–531 still holds several notable clusters.
🧭 The broader setup is currently balanced. Breaking above 497.9 would increase the probability of a sweep toward 505–512; if momentum continues, 515–527 becomes the next liquidity zone. Losing 488.9 would instead shift attention toward 485–481 and then 474–470.