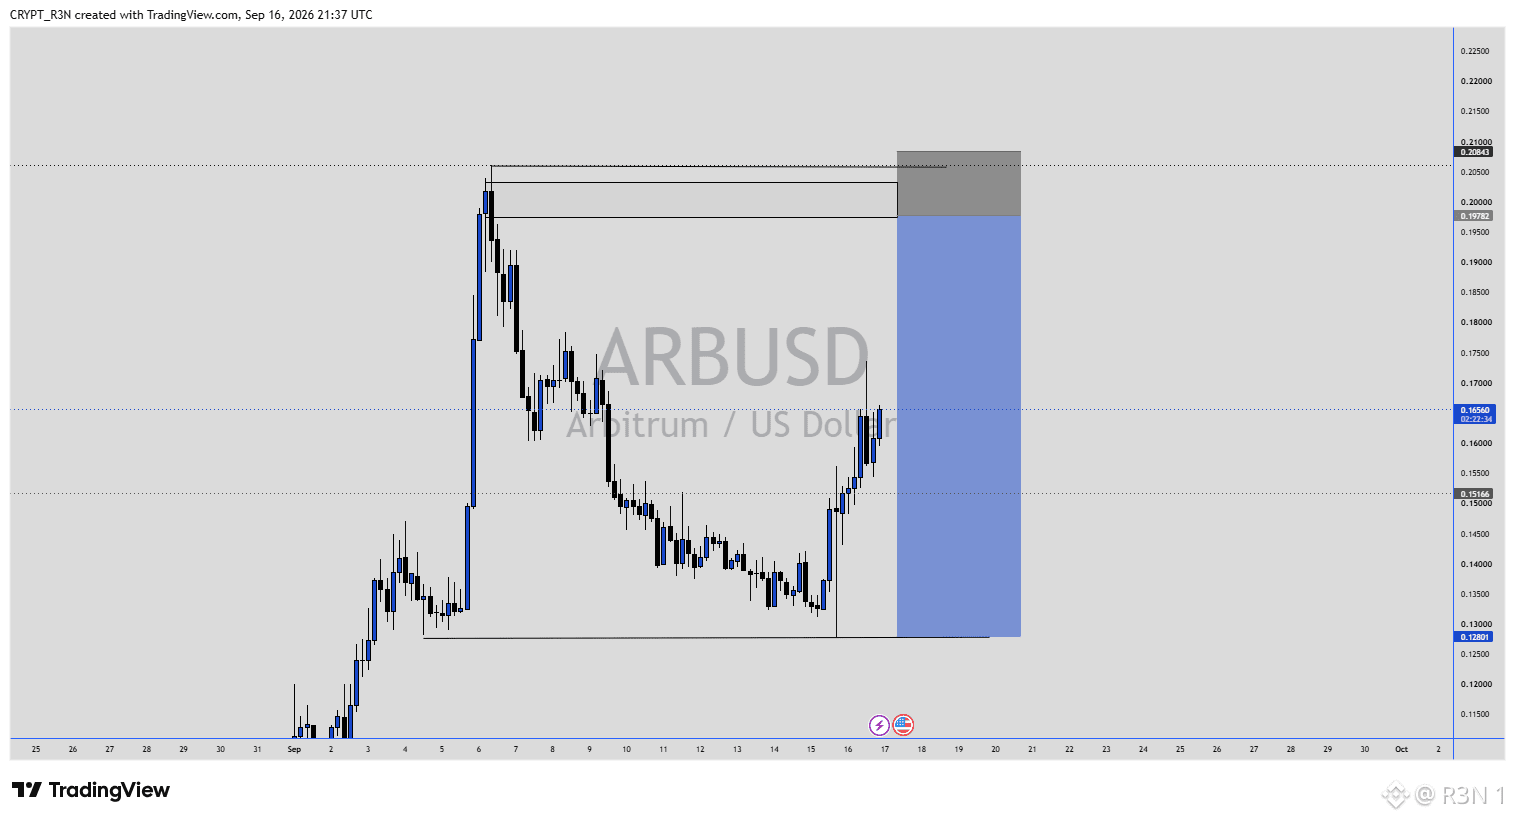
$ARB just ripped off its September low in a single session, from around $0.128 to $0.16563 currently, one of the sharper reversal candles on this chart since the initial early September spike. Zooming out, $ARB rallied hard from roughly $0.11 in late August to a spike high near $0.205 around September 5 to 6, then spent the following ten days grinding lower through a choppy range, roughly $0.135 to $0.175, before testing down into the $0.128 to $0.13 zone I've marked as support on this chart. That low held, and the bounce off it has been immediate and sharp rather than a slow grind back up. What I'm watching structurally is the $0.198 to $0.2084 zone marked at the top, the area where that initial spike topped out and where price got rejected on the way down. That's the level that actually matters here, not the September low. Reclaiming and holding above it would be a real structural shift, a fresh high rather than just a recovery back into the prior range. My honest read: this bounce is constructive, holding a defined support level and reversing sharply off it is a legitimate bullish signal in isolation. But I'd be careful calling this a trend change yet, ARB is still trading well inside the range it's carved out since the initial spike, and this could just as easily be another rally that fades back into the same $0.135 to $0.175 chop that dominated most of September. Where I'd push back on getting ahead of this: one sharp bounce off support after ten days of grinding lower isn't the same as a confirmed reversal, the real test is whether this move actually challenges that upper resistance zone or stalls out well below it again. What I'm watching: whether this bounce extends toward $0.175 to $0.198 with real follow through, or whether it fades back into the range like the last few attempts have. #BTC Price Analysis# #Meme Alpha#

Veröffentlichen

--
Haftungsausschluss: Enthält Meinungen von Drittanbietern. Keine Beratung. Binance AI wird ohne Gewähr bereitgestellt. Siehe AGB.