DAILY SIGNAL — SOL/USDT
Date: 16 Sep 2026 Timeframe: 1m Intraday Bias: Bullish breakout → retest → continuation
📊 Market Bias
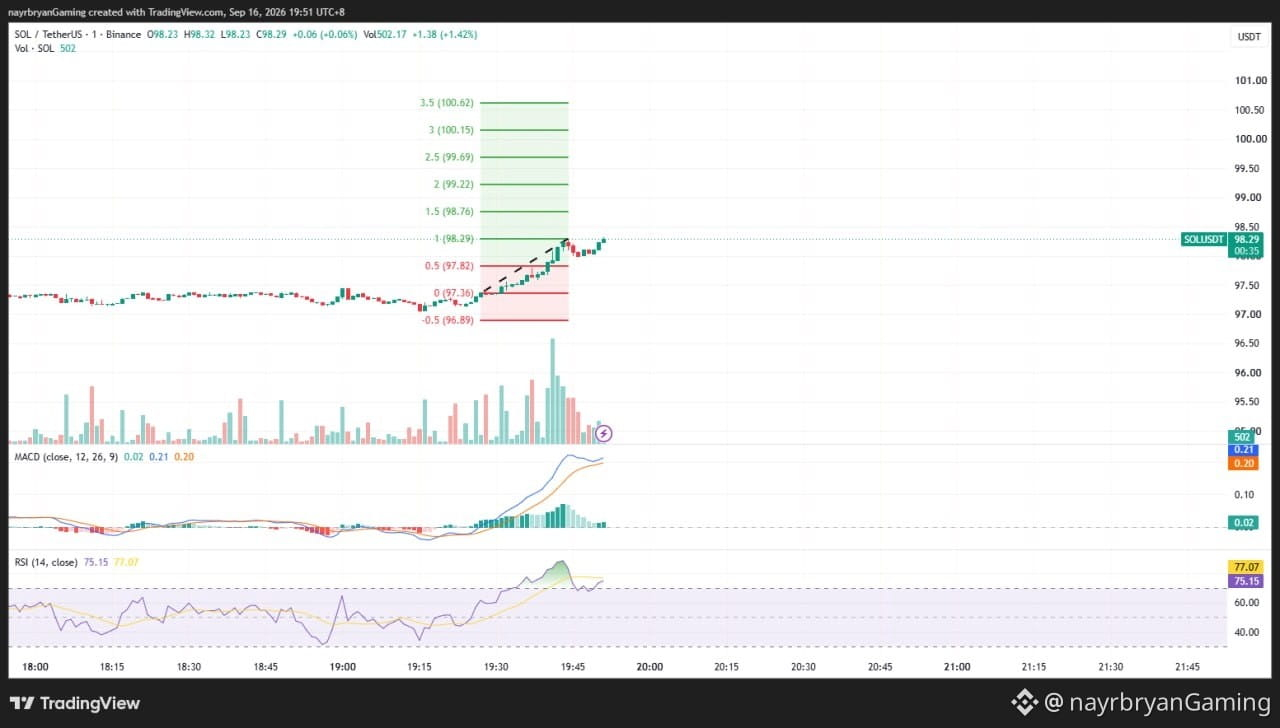
SOL has broken above the previous consolidation range and reclaimed the 97.60–97.88 structure zone.
Price is currently trading around 98.15, above the breakout area, while the rising structure remains intact.
The breakout is supported by expanding momentum, although the current RSI reading indicates that price is already approaching a stronger momentum area.
🔹 Key Levels From Chart
Entry Zone — Long Retest Bias: 97.82 → 98.00
Key Support / Breakout Zone: 97.60 → 97.88
Invalidation: Below 97.36
🎯 Upside Fibonacci Targets
TP1 → 98.29 (1.0 Fib) TP2 → 98.76 (1.5 Fib) TP3 → 99.22 (2.0 Fib) TP4 → 99.69 (2.5 Fib) TP5 → 100.15 (3.0 Fib) TP6 → 100.62 (3.5 Fib)
📈 Technical Breakdown
SOL spent an extended period consolidating inside the 97.60–97.88 area before making a strong upside expansion.
The latest move pushed price above the horizontal structure and into the Fibonacci expansion zone.
MACD is strongly positive, showing expanding bullish momentum.
RSI is around 67.61, indicating strong momentum and proximity to the upper momentum range.
A successful retest of the 97.82–98.00 area could keep the breakout structure intact.
If price falls back below 97.36, the current bullish breakout framework should be reassessed.
🧠 Quick Insight
“After a breakout, patience matters more than prediction. Let the retest reveal the strength.”
⚠️ Disclaimer
This is personal market analysis, not financial advice. This chart framework is for educational purposes only.
Always DYOR / DYODD, manage risk properly, and avoid emotional trading.
— @nayrbryanGaming #SOL #SOLUSDT #Crypto #Trading #TechnicalAnalysis #PriceAction #Fibonacci #Binance #DYOR #NFA #NoFOMO
Date: 16 Sep 2026 Timeframe: 1m Intraday Bias: Bullish breakout → retest → continuation
📊 Market Bias
SOL has broken above the previous consolidation range and reclaimed the 97.60–97.88 structure zone.
Price is currently trading around 98.15, above the breakout area, while the rising structure remains intact.
The breakout is supported by expanding momentum, although the current RSI reading indicates that price is already approaching a stronger momentum area.
🔹 Key Levels From Chart
Entry Zone — Long Retest Bias: 97.82 → 98.00
Key Support / Breakout Zone: 97.60 → 97.88
Invalidation: Below 97.36
🎯 Upside Fibonacci Targets
TP1 → 98.29 (1.0 Fib) TP2 → 98.76 (1.5 Fib) TP3 → 99.22 (2.0 Fib) TP4 → 99.69 (2.5 Fib) TP5 → 100.15 (3.0 Fib) TP6 → 100.62 (3.5 Fib)
📈 Technical Breakdown
SOL spent an extended period consolidating inside the 97.60–97.88 area before making a strong upside expansion.
The latest move pushed price above the horizontal structure and into the Fibonacci expansion zone.
MACD is strongly positive, showing expanding bullish momentum.
RSI is around 67.61, indicating strong momentum and proximity to the upper momentum range.
A successful retest of the 97.82–98.00 area could keep the breakout structure intact.
If price falls back below 97.36, the current bullish breakout framework should be reassessed.
🧠 Quick Insight
“After a breakout, patience matters more than prediction. Let the retest reveal the strength.”
⚠️ Disclaimer
This is personal market analysis, not financial advice. This chart framework is for educational purposes only.
Always DYOR / DYODD, manage risk properly, and avoid emotional trading.
— @nayrbryanGaming #SOL #SOLUSDT #Crypto #Trading #TechnicalAnalysis #PriceAction #Fibonacci #Binance #DYOR #NFA #NoFOMO